GOSH
Look at what I missed!
The yellow line was there, H4 close + 50% momo.
The red one is the adjusted price level (and I drew it now).
The funny part is that I missed the trade because I’m at work
How to be a MOnster
Moderator: moderators
- Mira
- rank: 1000+ posts
- Posts: 1729
- Joined: Thu Nov 10, 2016 8:37 pm
- Reputation: 1608
- Gender:
- Contact:
Re: How to be a MOnster
__________ THE IS A LIE__________
Please add www.kreslik.com to your ad blocker white list.
Thank you for your support.
Re: How to be a MOnster
Nice mira! i was asleep so i missed it also.
figured id post this too. these situations still get me. M30 with H4 overlay. both black and blue lines have a wick and a close. one worked one didnt.
- Mira
- rank: 1000+ posts
- Posts: 1729
- Joined: Thu Nov 10, 2016 8:37 pm
- Reputation: 1608
- Gender:
- Contact:
Re: How to be a MOnster
nat wrote:Nice mira! i was asleep so i missed it also.
figured id post this too. these situations still get me. M30 with H4 overlay. both black and blue lines have a wick and a close. one worked one didnt.
12617.png
Look at the bigger close, price often shows some resistance around that line.. it could be a first "target".
However, if you drop your line down to the M30 close you can see it from a different perspective
__________ THE IS A LIE__________
Re: How to be a MOnster
Mira wrote:thepark wrote:
I guess I have a lot of potential trade ideas, but ever since adopting the mindset of making lines and sizing up, I don't have a filter or structure and all trades seem viable due to the smaller pip targets....Realistically how many trades are in this chart?
There are multiple options, as MO told.
You should wait for a reply from MightyOne but IMO you’re looking too hard.
Looking at the chart he is trading a D1 watching the H4 (every D1 line is 2 H4 lines).
Price makes 2+ closes or a wick + a close etc. in a tight area (2 D1 lines i.e.) AND a BO out of that area.
Risk 2 daily lines and make 2 daily lines. Stop.
(the blue line is representing another thing for me.. it’s a H4 chart. Do you see the first close + close above/below? Then, at the same line, price makes a wick + a close and another BO. These are two charts in one!)
Thanks Mira. I think you know this method as well as anyone so your input is valuable
Are you normally sized to H1 lines (0.5*h1 atr) trading h4?
Also I don't get the whole close close and close wick thing. Can I just think of it as H4 breaking out from a price level and returning to it without closing over or under it? That seems to be the price action on your usdcad long.
If it's not too much can you show me some examples of defining a price level with the close close and close wick? Another year and I'm losing hope..
- aliassmith
- rank: 5000+ posts
- Posts: 5057
- Joined: Tue Jul 28, 2009 9:50 pm
- Reputation: 2847
- Gender:
Re: How to be a MOnster
aliassmith wrote:Libertarian wrote:Mira wrote:Another loss I’m back in the 95%
The problem is that I can’t see my mistake.
4395EBAD-42B3-4CAD-B2DE-2431DD3ECECC.png
I made a similar mistake, but do everything in your power not to let it get in your head. Like MO said, your goal should be to continuously apply your principles. Your not going to win them all...unless your Alias, or MO, or Jala, or Dragon,. (I'm really writing this to myself ). Risk lines, make lines...Its the new 50%
usdjpy-m15-capital-city-markets-2.png
Lol I don't win them all. I only had a great streak. I fully expect to get back to my 75%ish average.
Sometimes the market is nice to me!
Ya there are squigglies on there, sue me
- Attachments
-
- Capture+_2017-12-07-05-46-25.png (243.24 KiB) Viewed 3528 times
Trade Your Way as Long as It Makes Money!
Please add www.kreslik.com to your ad blocker white list.
Thank you for your support.
- Mira
- rank: 1000+ posts
- Posts: 1729
- Joined: Thu Nov 10, 2016 8:37 pm
- Reputation: 1608
- Gender:
- Contact:
Re: How to be a MOnster
thepark wrote:Mira wrote:thepark wrote:
I guess I have a lot of potential trade ideas, but ever since adopting the mindset of making lines and sizing up, I don't have a filter or structure and all trades seem viable due to the smaller pip targets....Realistically how many trades are in this chart?
There are multiple options, as MO told.
You should wait for a reply from MightyOne but IMO you’re looking too hard.
Looking at the chart he is trading a D1 watching the H4 (every D1 line is 2 H4 lines).
Price makes 2+ closes or a wick + a close etc. in a tight area (2 D1 lines i.e.) AND a BO out of that area.
Risk 2 daily lines and make 2 daily lines. Stop.
(the blue line is representing another thing for me.. it’s a H4 chart. Do you see the first close + close above/below? Then, at the same line, price makes a wick + a close and another BO. These are two charts in one!)
Thanks Mira. I think you know this method as well as anyone so your input is valuable
Are you normally sized to H1 lines (0.5*h1 atr) trading h4?
Also I don't get the whole close close and close wick thing. Can I just think of it as H4 breaking out from a price level and returning to it without closing over or under it? That seems to be the price action on your usdcad long.
If it's not too much can you show me some examples of defining a price level with the close close and close wick? Another year and I'm losing hope..
I’m using EIGHTS based on what I see, if the pattern fits in 2 lines on the hourly then I’m trading the hourly.
I’m not merging two timeframes for now.
The USDCAD price action was a H4 close + adjusted level on the M30 (See that M30 closed below and then above the red line).
At the moment I’m not trading the close + close / wick + close method and I’m not at my pc so I’m going to post a pure example:
Acqua lines (imagine that they are from EIGHTS) show a wick + close + bullish BO, red lines a close + close + bearish BO.
I’m not natural with this techniques but if you think about it then it’s simple: price is ‘ranging’ between 1 or 2 lines, then it breaks and you trade in that direction.
__________ THE IS A LIE__________
- Mira
- rank: 1000+ posts
- Posts: 1729
- Joined: Thu Nov 10, 2016 8:37 pm
- Reputation: 1608
- Gender:
- Contact:
Re: How to be a MOnster
I don’t know if you have any social network, I have an Instagram page and I even don’t know why because it’s a waste of time.
BTW
Just try to write “forex” or “trading” and take a look.
Everybody is making money forums are full of people draining their own account but NOT on instagram.
1000+ screenshots everyday showing massive gains and horrible charts.
No money management, only swap levels and breakout trades.. WTF.
Are they scammers or what?
__________ THE IS A LIE__________
-
- rank: 50+ posts
- Posts: 63
- Joined: Wed Oct 04, 2017 9:04 pm
- Reputation: 75
- Location: houston tx
- Real name: steve
- Gender:
Re: How to be a MOnster
Mira wrote:I don’t know if you have any social network, I have an Instagram page and I even don’t know why because it’s a waste of time.
BTW
Just try to write “forex” or “trading” and take a look.
Everybody is making money forums are full of people draining their own account but NOT on instagram.
1000+ screenshots everyday showing massive gains and horrible charts.
No money management, only swap levels and breakout trades.. WTF.
Are they scammers or what?
as we all know 95 % of traders lose...
believe half of what you see and none of what you hear.
the rat zone for life
Re: How to be a MOnster
Please consider how long it might take someone to respond when asking questions: just 1 simple question can consume 20 minutes if I have to stop what I am doing, mark a chart, think about how I am going to explain it, and type it up...multiply that by x10 questions and that is how much time you are requesting of me
C+W or W+C:
One closes within x number of lines and the other opens outside of the area, touches it, and then retreats.
In this example you are looking for a short at or above the red line because of a larger chart as you do not have a CC, CW, or WC.
If there were no larger chart, and the red line did not exist, then you could go short after the orange candle gave you a double close.
Somewhere below the zone there is going to be a target area that is used by both long and short traders to take profit, continue long, or continue short (you can't 'continue long/short' if you haven't banked a profit)
thepark wrote:Code: Select all
First of all, thanks for this post. I am trying to clarify everything so apologies for being verbose and pedantic
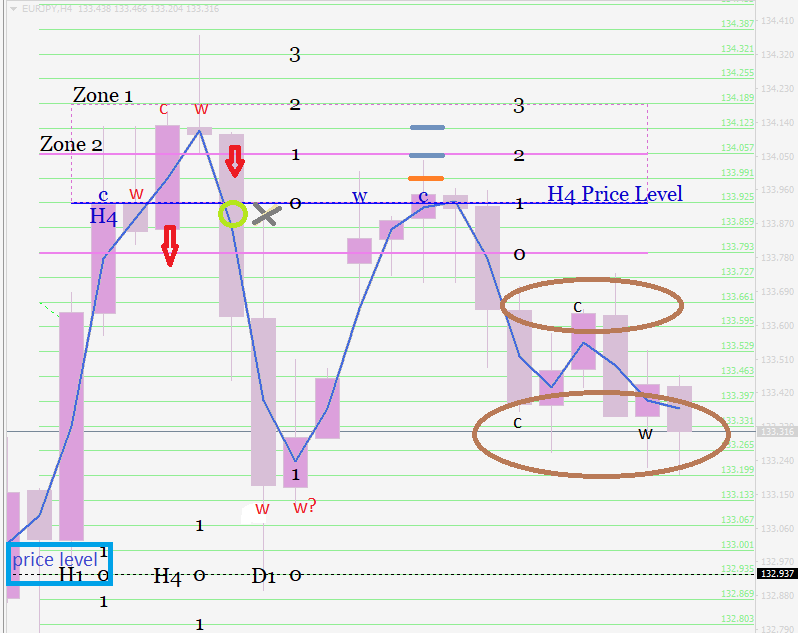
a. Why is the wick (where I marked red w) not marked as a w and therefore a valid price level? Given the wick on c as well, I would be thinking potential short here and would probably look for a short on M30 breakout/breakin on the next candle.
b. isn't where I marked my first c significant? given it closed beyond the extreme of the first close. The next candle is a wick, so another close wick and potential short. Am I judging the situation completely wrong? Is it possible to see more examples of CC and CW?
c. price goes down to the green circle. Isn't this return to the origin of the long breakout at 133.925 a potential long if it wicked there? it would be a w right?
d. the gray x is a breakout and breaking back to 133.925 for a potential short.
e. price wicks 132.97, considering there was a previous price level there. wouldn't you try to long on the next candle where there is a 1 on it? Up to that point it is a massive return to the original long breakout point.
f. After your marked up w, do you try to short on the next H4 candle or are you thinking this can go back to the top of zone 1?
g. If your second marked up c closed on any of the three lines above, are you still thinking short? if its in that zone but M30 or H1 is stalling, breaking down and back up, I would short it.
h. the lone c in the top brown oval is a breakout down and return to pattern. Potential short?
i. a close and a wick for the bottom brown oval. Potentai long here if there is a M30 bo/bi
j. How do you visualize and draw the 2 zones? I can't express in words what it is for...but all those lines look useful to gauge the strength of the return to pattern where you marked your w.
I guess I have a lot of potential trade ideas, but ever since adopting the mindset of making lines and sizing up, I don't have a filter or structure and all trades seem viable due to the smaller pip targets....Realistically how many trades are in this chart?
Re: How to be a MOnster
aliassmith wrote:
Sometimes the market is nice to me!
Ya there are squigglies on there, sue me
Whatever squiggly floats your boat
Please add www.kreslik.com to your ad blocker white list.
Thank you for your support.