How to be a MOnster
Moderator: moderators


Re: How to be a MOnster
Thanks Guys, what is best time of day to trade these (DAX, S&P,France 40 index)? NY pit open -> noon?
Please add www.kreslik.com to your ad blocker white list.
Thank you for your support.
Thank you for your support.
-
Mira

- rank: 1000+ posts

- Posts: 1729
- Joined: Thu Nov 10, 2016 8:37 pm
- Reputation: 1608
- Gender:

- Contact:
Re: How to be a MOnster
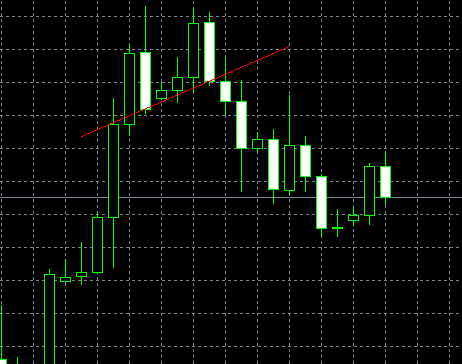
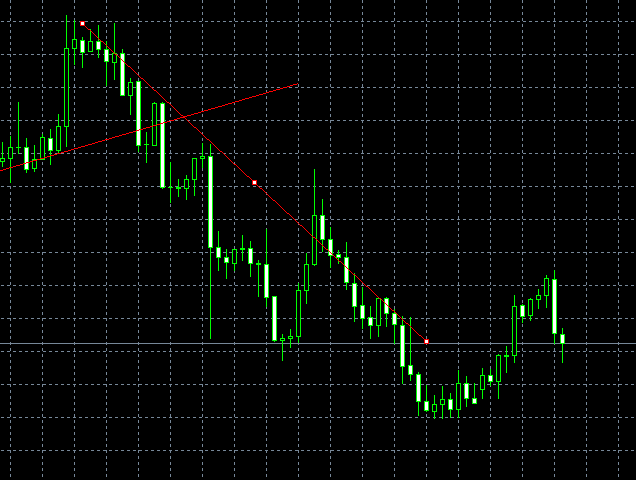
You draw a line on Friday and price makes Stranger Things on Monday 
- 20C670FA-2A46-43B8-A8AF-30FCB87CF91C.png (73.54 KiB) Viewed 2935 times
__________ THE  IS A LIE__________
IS A LIE__________-
LeMercenaire

- rank: 1000+ posts
- Posts: 3184
- Joined: Tue Sep 27, 2016 12:11 am
- Reputation: 2303
- Gender:
Re: How to be a MOnster
Leoheart wrote:Thanks for responding LeMercenaire. Dude I gotta ask. What's F40, I actually googled it...
Yeah, lol, sorry guys, it's the spread-betting designation for the CAC 40 / France 40.
Not this...though it does give me an excuse to post a gratuitous Ferrari
- Ferrari F40 LM Black.jpg (25.11 KiB) Viewed 2930 times
Re: How to be a MOnster
Are there any indicator that do a good job with price overlay? I used to use 'Netdania' back in the days to see negative correlation, not seeing that function anymore. Had a thought today, want to overlay highly correlated pairs Ie Gpbusd Gbpjpy and play around with the idea of treating the candles as one.
-
LeMercenaire
- rank: 1000+ posts
- Posts: 3184
- Joined: Tue Sep 27, 2016 12:11 am
- Reputation: 2303
- Gender:
Re: How to be a MOnster
[quote="Leoheart"]Are there any indicator that do a good job with price overlay? I used to use 'Netdania' back in the days to see negative correlation, not seeing that function anymore. Had a thought today, want to overlay highly correlated pairs Ie Gpbusd Gbpjpy and play around with the idea of treating the candles as one.[/quote]
Interesting.
Interesting.
Please add www.kreslik.com to your ad blocker white list.
Thank you for your support.
Thank you for your support.
-
Mira
- rank: 1000+ posts
- Posts: 1729
- Joined: Thu Nov 10, 2016 8:37 pm
- Reputation: 1608
- Gender:
- Contact:
Re: How to be a MOnster
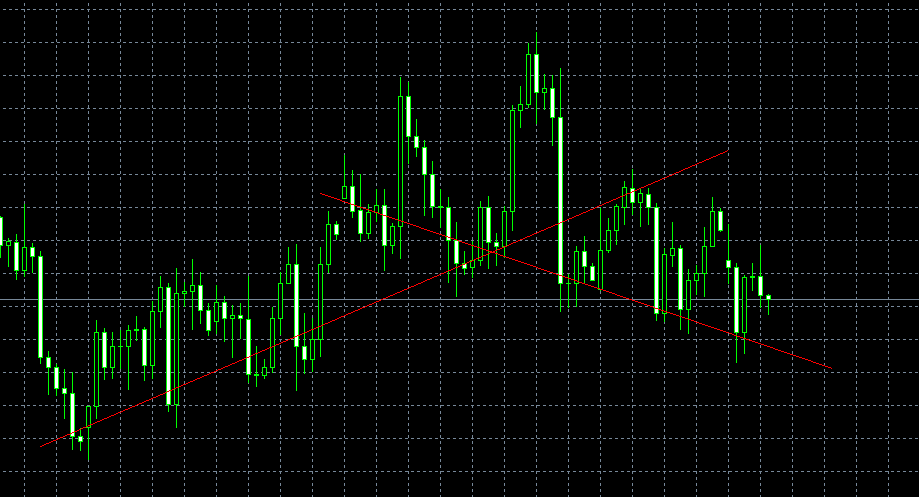
Trend(S)
- D4FFA555-207E-48F6-AD55-49EC123E7504.png (79.82 KiB) Viewed 2904 times
__________ THE IS A LIE__________
IS A LIE__________
Re: How to be a MOnster
MightyOne wrote:Mira wrote:
Yes, I see that you are not mentioning any of that things..
But if I trade a zone “blindly” how can I see that the chart is supporting my idea?
A wick looks like a way to see price saying “hey, I can’t go over here”. Is it right?
How do you deal with it, MO?
Thank you very much !!
I think that I speak plainly but no one ever understands me
It is exactly as I have explained it...
the daily is looking for a short, the H4 is looking for a short, the M30 is looking for a short, & there is 'harmony' between the periods.
for_mira1.pngfor_mira2.pngfor_mira3.png
Experience brings knowledge of various nuances which add rays of light and expands your awareness: no one can give you light, you must seek it daily.
for_mira4.png
Secrecy is darkness: there is nothing hidden which illuminates; why don't they understand?
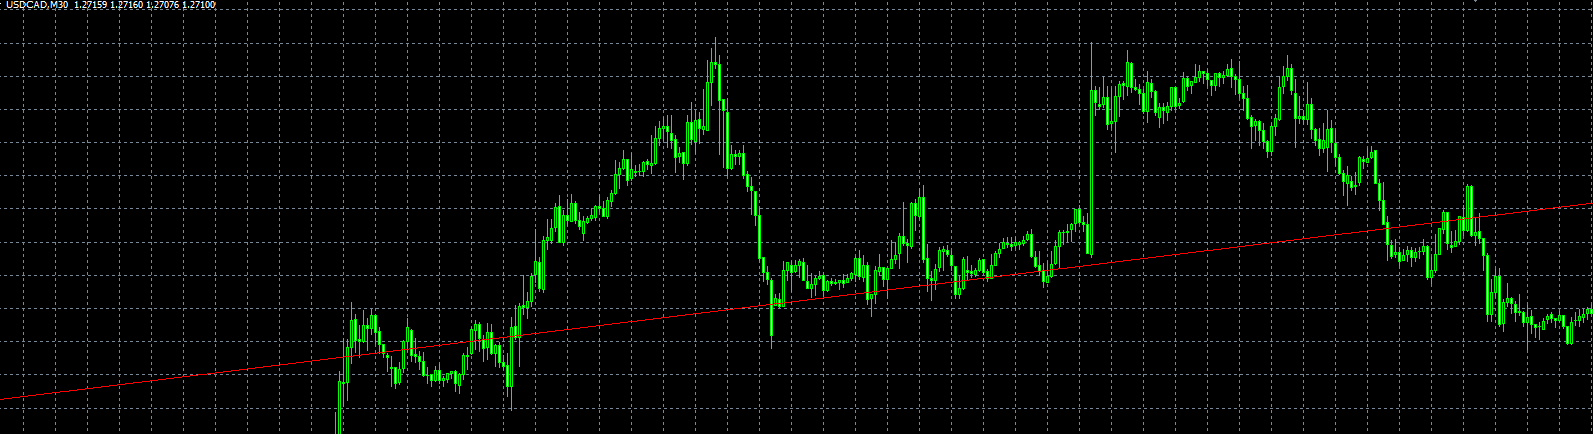
hi MO, in this example why are we not looking for longs? I see the origin of the D1 breakout points as potential areas to long in the diagonal up line. But you identified it as D1 looking for shorts long before.
I understand that you said it moved out of a D1 pattern and that is why you would short, but I wouldn't be thinking short until it broke the bottom of the diagonal line signaling that the breakin is now a "breakout" to the opposite side.
Of course I wouldn't blindly long once it hit the diagonal line, but look for some sort of bo/bi on M15 or M30 but I want to understand your perspective.
Re: How to be a MOnster
Mira wrote:MightyOne wrote:for_Mira.png
Am I following?
D99E62EB-F52D-4461-8B94-3465C4FC947A.jpeg
Thanks MO
Hi Mira and MO, I dont quite understand that two closes is a price level because my view is that H4 has many closes which ultimately leads to considering many price levels which I've marked below in green. However the correct one that you marked up with two closes is the one I don't understand: it is an up candle that wicked then made an inside candle. To me the significance of these two candles is only that the high is a long wick proceeded by a smaller wick which may signal "wick in the direction of loss" It is an inside candle that starts from the close of the up candle and its not like it attempted to break and failed to close any higher like the second pic with the 3 candles.
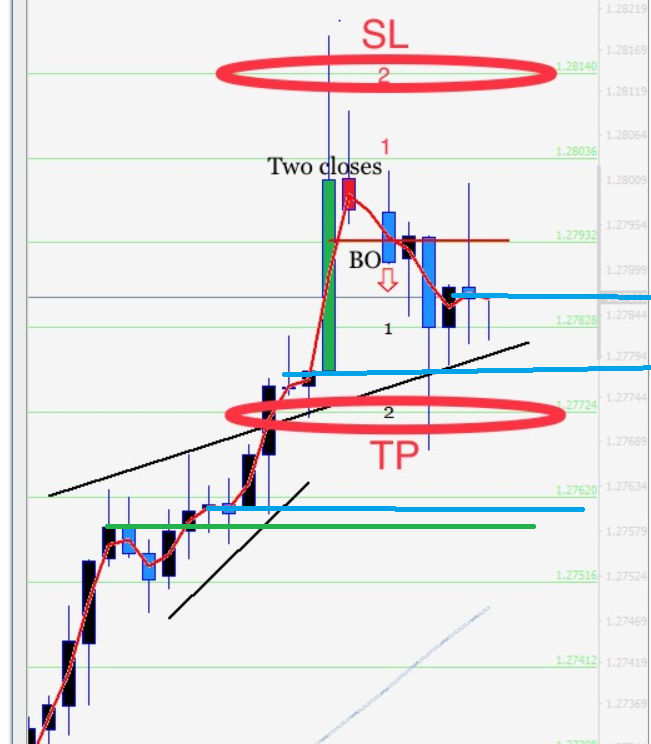
Is there any significance to the fact that, it also obeyed this line of origin from breakouts in the manner of this on the H4 which I found in MO's teachings in the second pic below this? Otherwise I don't understand how that price level was picked.
Last edited by thepark on Tue Nov 14, 2017 3:18 pm, edited 2 times in total.
Re: How to be a MOnster
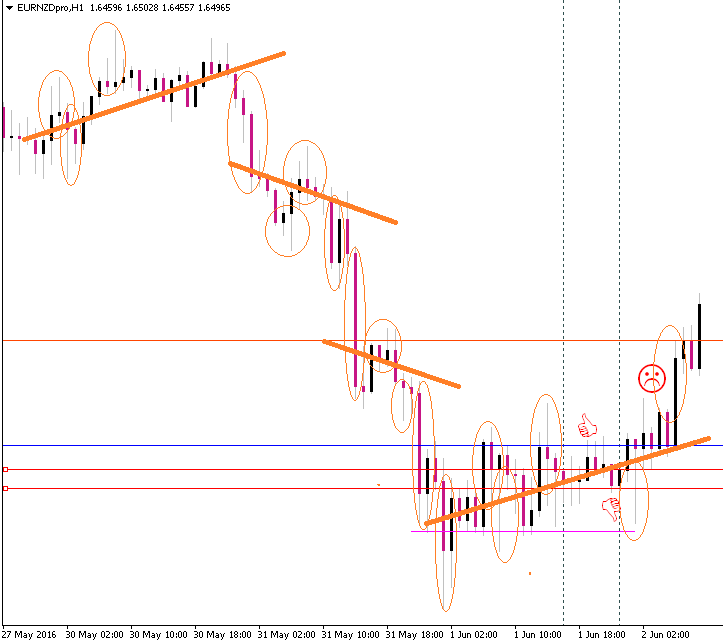
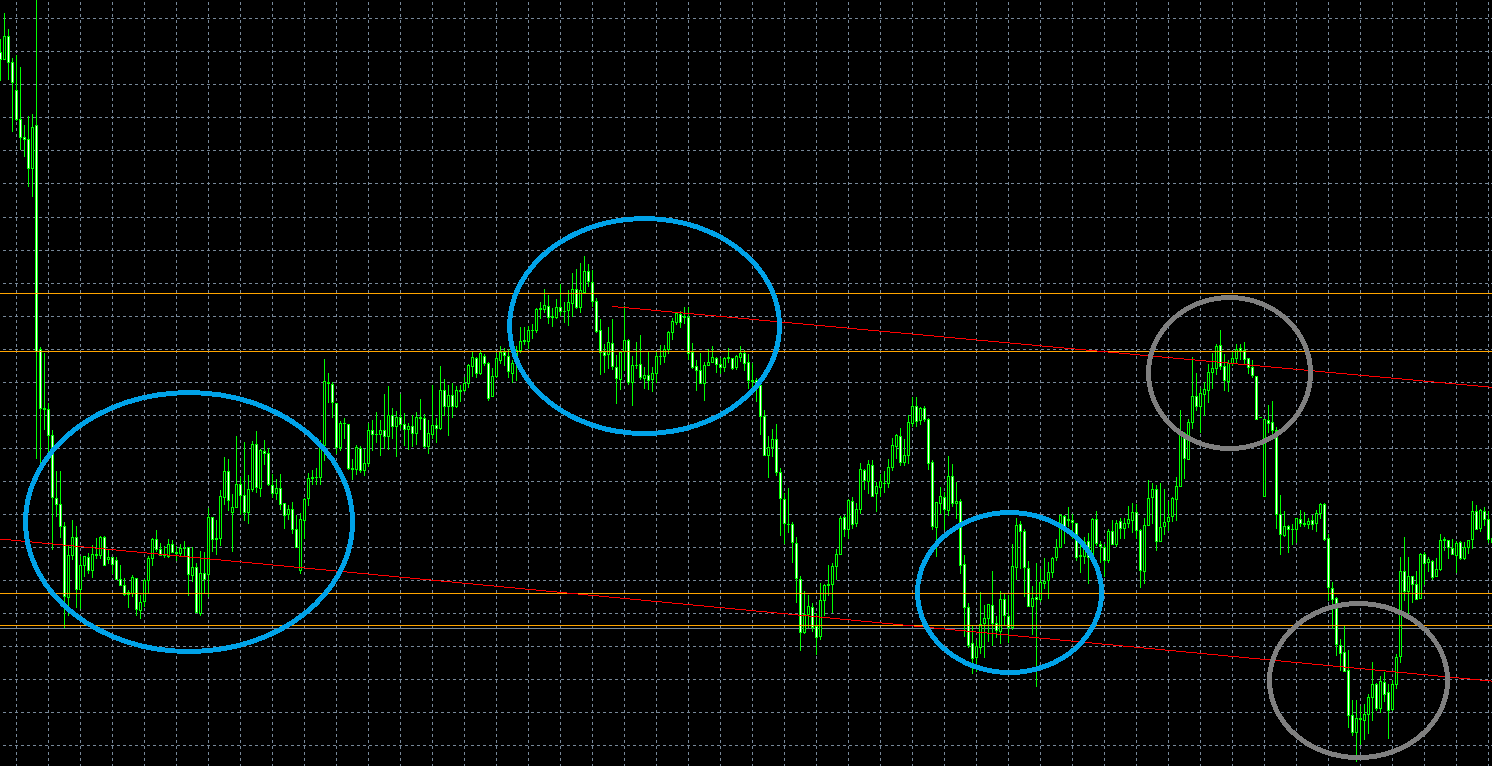
Sorry Mira for hijacking your thread, one last question for tonight about M30 entries:
Here is my thinking process. H8: Trace the origin of breakouts.
H4:adjust with two closes price level
M30: in the three green circles, price breaks out then price in at least twice allowing a safe place to enter. In the Gray circles although we identified them to be likely levels based on higher time frames, it basically just breaks out and doesn't return. Would you enter in the gray circles? How would you enter?


Re: How to be a MOnster
thepark wrote:Hi Mira and MO, I dont quite understand that two closes is a price level because my view is that H4 has many closes which ultimately leads to considering many price levels which I've marked below in green. However the correct one that you marked up with two closes is the one I don't understand: it is an up candle that wicked then made an inside candle. To me the significance of these two candles is only that the high is a long wick proceeded by a smaller wick which may signal "wick in the direction of loss" It is an inside candle that starts from the close of the up candle and its not like it attempted to break and failed to close any higher like the second pic with the 3 candles.
That chart was actually just marked as a simple Rat trade.
I'm not saying that every two closes is a price level...
It takes spatial intellect to visualize what you are looking for in a compressed form.
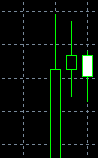
1. Price moves to a pattern (close)
2. Price moves away from a pattern (breakout)
3. Price returns to a pattern (close)
It can take shape a number of different ways:
1. send up a wick (touch, breakout)
2. return to the wicked area (close)
or it could BDP +WDL:
1. moves to a pattern (close)
2. moves out of a pattern (breakout)
3. sends up a wick (touch, breakout)
Can you see what I am trying to describe?
- for_you.png (4.83 KiB) Viewed 2935 times
Please add www.kreslik.com to your ad blocker white list.
Thank you for your support.
Thank you for your support.