MightyOne wrote:thepark wrote:
hi MO
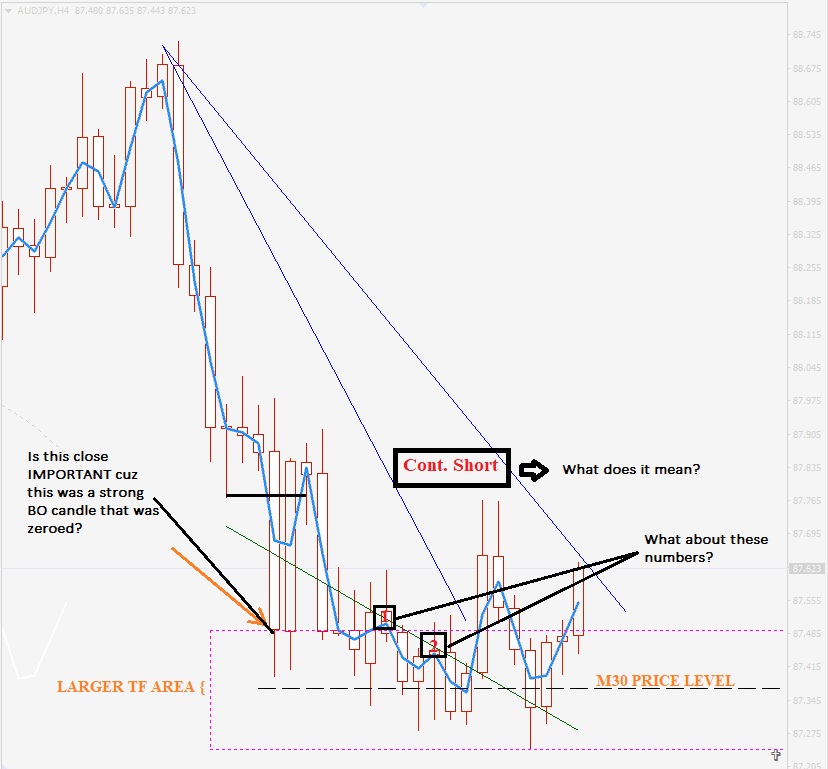
For this markup. what is the significance of the M30 close overs?
I would just long on the bottom of the H4 break ins, with the second long around the red horizontal line. And possibly a short on one of the most recent wicks in your chart. Can you provide some feedback? thanks.
https://www.kreslik.com/forums/therumpledone/how-to-be-a-monster-t16383/page1030
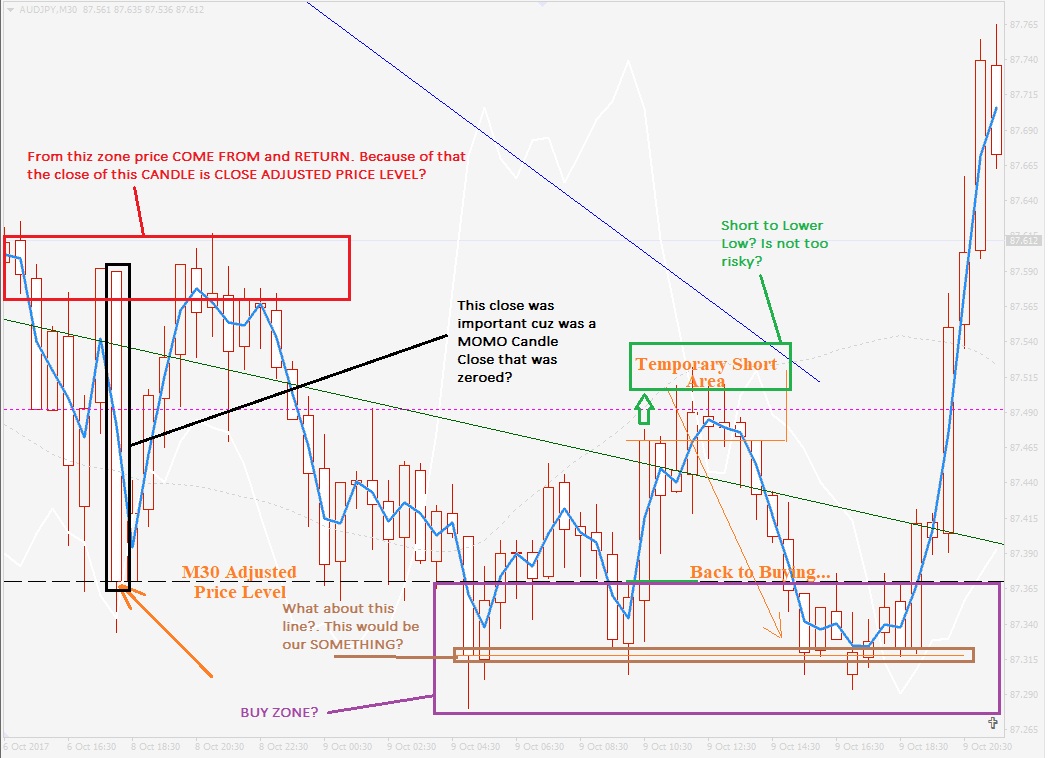
I use M30 because it is 1/8 of 240 minutes (M20 and 180 minutes is my second choice).
Large chart price levels are just a starting point, like saying "I know that I don't want to pay any more than $1170/oz"
Maybe there is a strong weekly close lower and you adjust it down to $1111/oz.
From there the daily closes lower at $1065 and the M30 forms a price level at $1055
You enter at M30 position sizing and reduce your position size when price hits $1065, $1111, and $1170/oz, and then
hold MN size for whatever the MN chart will give you.
If you have more time then you can spend weeks or months building a position size so that your profit per line is significant
even after taking profit 3 times.
How you size and risk your lines is completely up to you.
for_thepark.png
Thanks for this post MO!
I got it, I know I got it but I’m still making some mistake..
Maybe I need to “filter” my entries and trade off 3 semas or D1+ extremes..
MightyOne wrote:"Where did she come from and where did she go?"
Not just any old close but where a price move originated and where it went.
Now I’m taking the closing prices of the wickdolls, is this what you mean with that post?
Thank you much!
 IS A LIE__________