

v8power wrote:prochargedmopar wrote:v8power wrote:
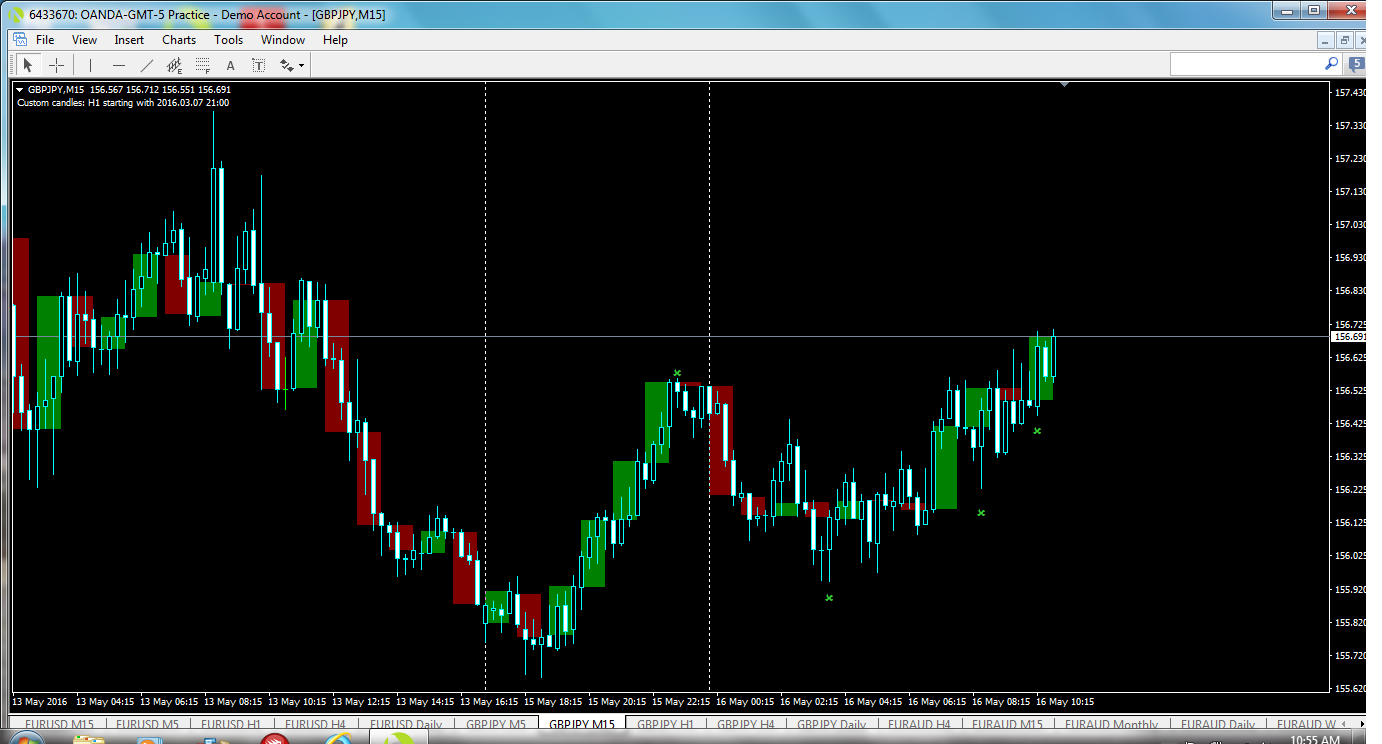
I see a nice possible set up. What are the green and red lines on your chart?
What way are you trading now?
I was using those to define my box for the London breakout during the month or so of testing.
They mean nothing on the above chart.
Bias of current 8hr chart swing would be up until proven wrong.
Price goes up and down so I must assume it will go up next before going down.
The orange X was an exception.
IMG_20160516_012952.jpg
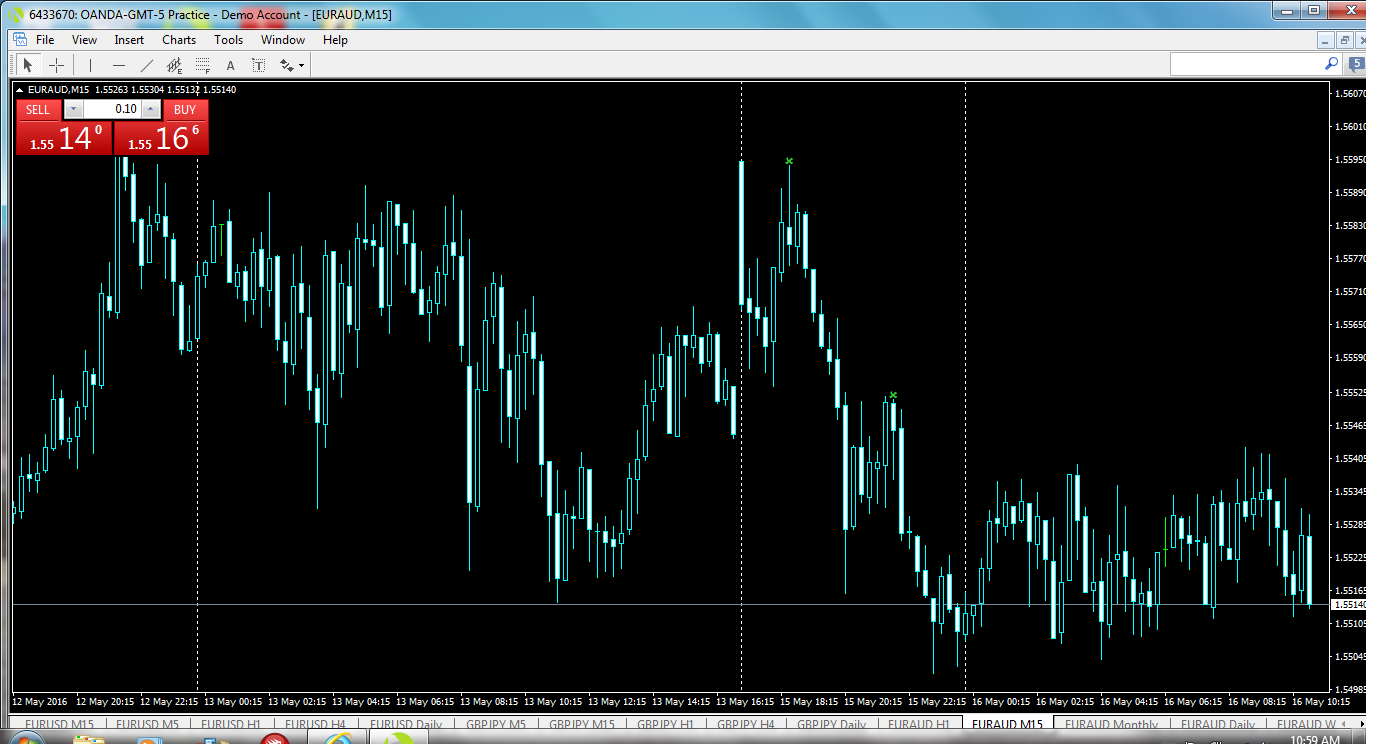
Whoa, Im lost. When I look at that chart I would say the bias is down.
What do u base price going from up to down and down to up. I see your up/down arrows, but dont know what they show. How do u decide to enter and what do u aim for. Can you show any actual trade u used this on and any lower time frame u used for entrys and exitz.
Im confused, but as long as it wins u money thats awesome.
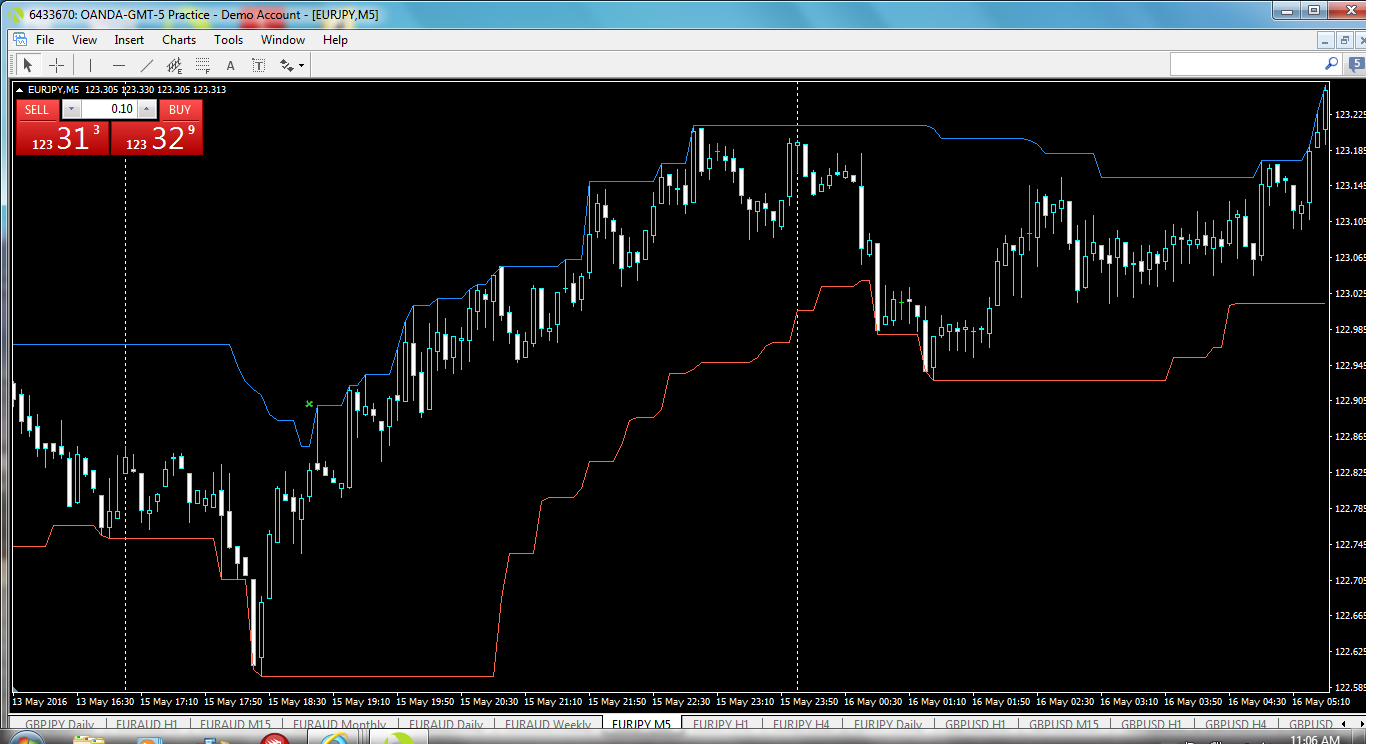
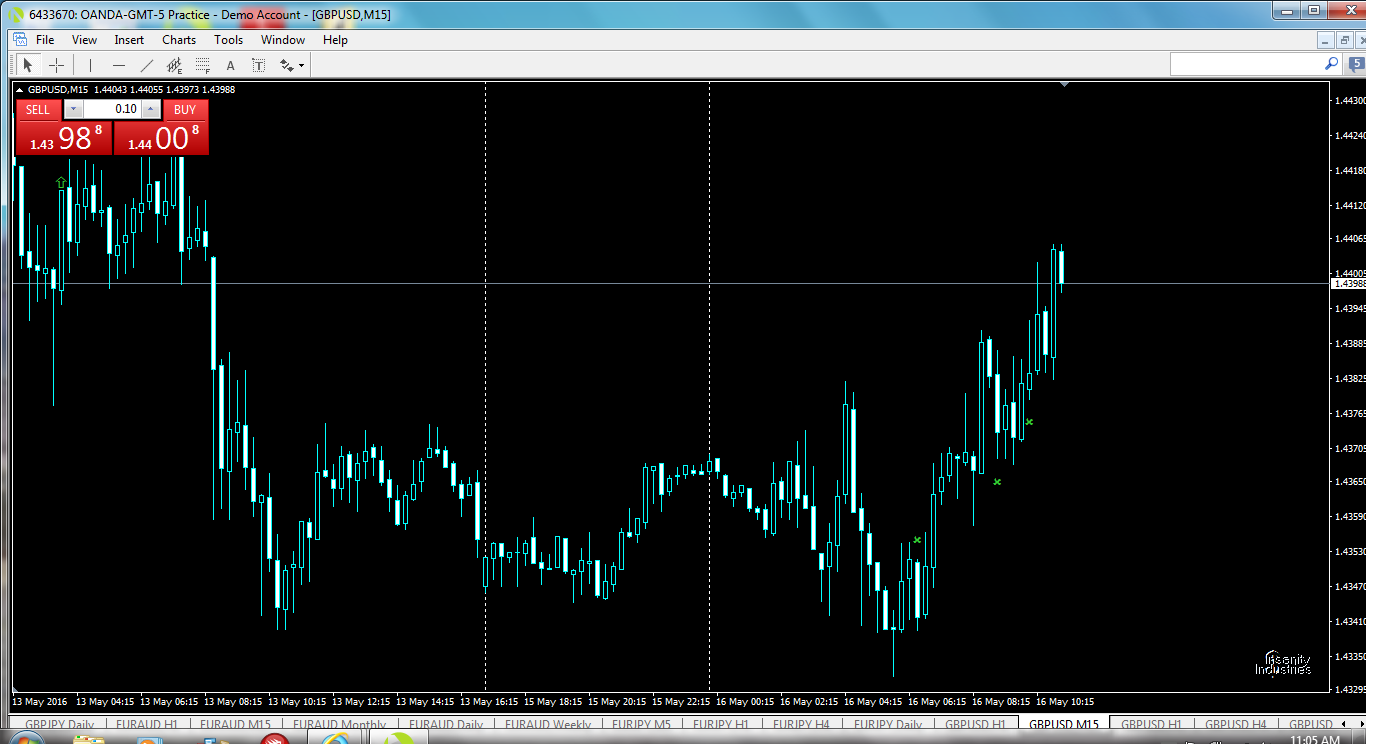
In the post before this one I posted a pic with a buy signal.
This post shows the result.
therumpledone/prochargedmopars-dart-dynasty-t10064/page490#p89436
Bodies show the way, wicks show not the way.
All positions are a sl on a htf chart.
Entries and lower/small tf's are irrelevant.
Position size is EVERYTHING as you yourself know to be a fact.
Without large size a person makes pips but not $$.
Trading is simple as you noted in previous posts by giving a couple SIMPLE methods to succeed with.
dchappy and TRO show the simplest of them all........
Heck, even ICT says to flip a coin @ the london open and go for 2 or 3:1 on every trade. Profit in your pocket by the end of the year.

 ][/quote]