Blind Mouse Strategy

free & uncensored discussion arena for TheRumpledOne

Moderator: moderators

User avatar
newark18
rank: 500+ posts
rank: 500+ posts
Posts: 562
Joined: Thu Mar 11, 2010 3:32 am
Reputation: 21
Real name: J
Gender: None specified

Postby newark18 » Tue May 25, 2010 7:04 pm

es/pip wrote:
MightyOne wrote:
gfg1 wrote:MO, recognizing that you use longer time frames (working to that goal someday), are fat cats viable on shorter time frames?

Example of 5min EU, where it appears 2 fat cats. There were closes below and then above fat cats. The reason for the "x" is that it would not have been valid entry as larger 3CC bar had not closed yet.

Once closed above, fat cat entry #1, take it up the extreme. Then wait for fat cat entry #2 and do same.

Do you agree?

TIA


Thou shalt not trade off of anything less than a daily+ extreme :lol:

I even made a picture for you:

Image


You cannot escape a long(er) term chart, you are just going to have to get used to looking at them.


can you post a daily chart showing where you got the line at 1.2177 from?


ES, I believe it is based on the 3rd to last candle.
Failure is an opportunity to learn.

Please add www.kreslik.com to your ad blocker white list.
Thank you for your support.

johny
rank: 50+ posts
rank: 50+ posts
Posts: 55
Joined: Thu Nov 19, 2009 11:53 am
Reputation: 0
Gender: Male

Postby johny » Tue May 25, 2010 7:07 pm

es/pip wrote:
MightyOne wrote:
gfg1 wrote:MO, recognizing that you use longer time frames (working to that goal someday), are fat cats viable on shorter time frames?

Example of 5min EU, where it appears 2 fat cats. There were closes below and then above fat cats. The reason for the "x" is that it would not have been valid entry as larger 3CC bar had not closed yet.

Once closed above, fat cat entry #1, take it up the extreme. Then wait for fat cat entry #2 and do same.

Do you agree?

TIA


Thou shalt not trade off of anything less than a daily+ extreme :lol:

I even made a picture for you:

Image


You cannot escape a long(er) term chart, you are just going to have to get used to looking at them.


can you post a daily chart showing where you got the line at 1.2177 from?


I think thats today's D1 low on MBT MT4. Placed that line once it made that low!!! :?

Best Regards,
Johny

User avatar
es/pip
rank: 1000+ posts
rank: 1000+ posts
Posts: 2898
Joined: Wed Jan 21, 2009 9:28 pm
Reputation: 11
Gender: None specified

Postby es/pip » Tue May 25, 2010 7:19 pm

yeah i see that

i thought he was basing the "extreme" off a previous daily candle.

the one thing i am still not sure about on all of this.

how do you know that the daily low is going to be the daily low. It is only the daily low one time.

i know you are going to say, " i don't, and momentum"

i just seem to have an issue when i think it is the low and then it ends up not being the low.

:?
Bend over and assume the position for another 4 years of hope and change.

User avatar
es/pip
rank: 1000+ posts
rank: 1000+ posts
Posts: 2898
Joined: Wed Jan 21, 2009 9:28 pm
Reputation: 11
Gender: None specified

Postby es/pip » Tue May 25, 2010 7:34 pm

[highlight=red]i am not in this trade[/highlight]

wish i was lol

target would be the cash zone--- way above here


Image
Bend over and assume the position for another 4 years of hope and change.

User avatar
es/pip
rank: 1000+ posts
rank: 1000+ posts
Posts: 2898
Joined: Wed Jan 21, 2009 9:28 pm
Reputation: 11
Gender: None specified

Postby es/pip » Tue May 25, 2010 7:41 pm

MightyOne wrote:
gfg1 wrote:MO, recognizing that you use longer time frames (working to that goal someday), are fat cats viable on shorter time frames?

Example of 5min EU, where it appears 2 fat cats. There were closes below and then above fat cats. The reason for the "x" is that it would not have been valid entry as larger 3CC bar had not closed yet.

Once closed above, fat cat entry #1, take it up the extreme. Then wait for fat cat entry #2 and do same.

Do you agree?

TIA


Thou shalt not trade off of anything less than a daily+ extreme :lol:

I even made a picture for you:

Image


You cannot escape a long(er) term chart, you are just going to have to get used to looking at them.


when you say

" this is not--- this is not this is not"

are you referring to it not being now, because we have moved off the low?

because on the way down it would have been a daily + extreme, correct?
Bend over and assume the position for another 4 years of hope and change.

Please add www.kreslik.com to your ad blocker white list.
Thank you for your support.

User avatar
Braathen
rank: 500+ posts
rank: 500+ posts
Posts: 615
Joined: Mon Jul 20, 2009 6:21 pm
Reputation: 15
Location: Infront of the PC O_o
Gender: Male

Postby Braathen » Tue May 25, 2010 8:18 pm

Hi MO :) So the daily + extreme is any price past yhigh/low?

I traded this thinking it was valid daily+ extreme and by the looks of your prev. post it seems ok.

Image
"Trading is the ability to see & to plan & to act; it is not crystal balls, precision entries, and ego stroking."
MO-

User avatar
TheRumpledOne
rank: 10000+ posts
rank: 10000+ posts
Posts: 15544
Joined: Sun May 14, 2006 9:31 pm
Reputation: 3035
Location: Oregon
Real name: Avery T. Horton, Jr.
Gender: None specified
Contact:

Postby TheRumpledOne » Tue May 25, 2010 8:51 pm

es/pip wrote:yeah i see that

i thought he was basing the "extreme" off a previous daily candle.

the one thing i am still not sure about on all of this.

how do you know that the daily low is going to be the daily low. It is only the daily low one time.

i know you are going to say, " i don't, and momentum"

i just seem to have an issue when i think it is the low and then it ends up not being the low.

:?


You know it IS the daily low NOW, but...

ANYTHING CAN HAPPEN!

You have to trade what you see and what you know.

You know the lowest price of the day SO FAR. That IS the daily low unless price makes a new daily low.

Sooner or later the daily low NOW WILL BE THE DAILY LOW after the day ends..
IT'S NOT WHAT YOU TRADE, IT'S HOW YOU TRADE IT!

Please do NOT PM me with trading or coding questions, post them in a thread.

User avatar
dragon33
rank: 500+ posts
rank: 500+ posts
Posts: 792
Joined: Thu Sep 18, 2008 2:41 pm
Reputation: 70
Gender: Male

Postby dragon33 » Tue May 25, 2010 9:19 pm

es/pip wrote:yeah i see that

i thought he was basing the "extreme" off a previous daily candle.

the one thing i am still not sure about on all of this.

how do you know that the daily low is going to be the daily low. It is only the daily low one time.

i know you are going to say, " i don't, and momentum"

i just seem to have an issue when i think it is the low and then it ends up not being the low.

:?


The daily+ extremen is also a strange puzzle for me. How can we know???
Trading is like cycling, first you need to learn how.
Two options: you either lose or win!

User avatar
es/pip
rank: 1000+ posts
rank: 1000+ posts
Posts: 2898
Joined: Wed Jan 21, 2009 9:28 pm
Reputation: 11
Gender: None specified

Postby es/pip » Tue May 25, 2010 9:39 pm

TheRumpledOne wrote:
es/pip wrote:yeah i see that

i thought he was basing the "extreme" off a previous daily candle.

the one thing i am still not sure about on all of this.

how do you know that the daily low is going to be the daily low. It is only the daily low one time.

i know you are going to say, " i don't, and momentum"

i just seem to have an issue when i think it is the low and then it ends up not being the low.

:?


You know it IS the daily low NOW, but...

ANYTHING CAN HAPPEN!

You have to trade what you see and what you know.

You know the lowest price of the day SO FAR. That IS the daily low unless price makes a new daily low.

Sooner or later the daily low NOW WILL BE THE DAILY LOW after the day ends..


yeah i understand that

is a daily+ low just for the current day?

or based on a previous days low ?
Bend over and assume the position for another 4 years of hope and change.

johny
rank: 50+ posts
rank: 50+ posts
Posts: 55
Joined: Thu Nov 19, 2009 11:53 am
Reputation: 0
Gender: Male

Postby johny » Tue May 25, 2010 10:46 pm

Yeah, daily+ low is just for the current day.

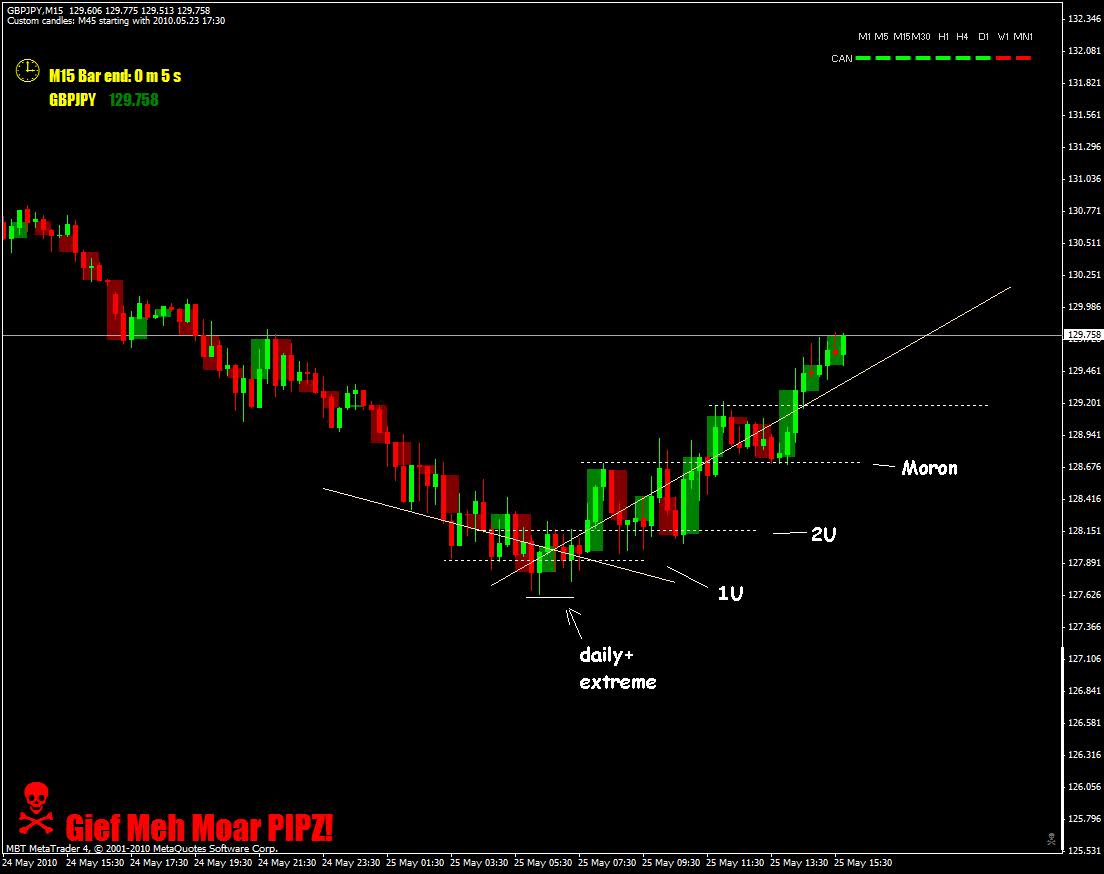
Daily+ extremes: Daily high/low, weekly high/low, Monthly high/low, Yearly high/low.

Following is a post from Mighty One. Kind of related to daily+ extremes (except entry/exit stuff):

Best Regards,
Johny

-------------------------------------

It is so easy that I am tempted to drink twice as much beer...

Risk 1% of high water mark ( if you have less than $1,000 then $1,000 is your high water mark).

20 pips = 1%

Wait for a daily or greater new high/low

When price retraces 5 or more pips click the button with a 20 pip SL.

If it is just single day new highs N' lows then I'd target 3-5%

If it is multi day new highs N' lows then I'd target 5%+

Weekly new highs N' lows I'd target 12-20%

Monthly new highs N' lows I'd target ~30-40%

Yearly new highs N' lows I'd target ~75-130%

There is only 1 highest and 1 lowest price with a bunch of gyrations in between no matter which time frame candle you are looking at.
As TRO says, price eventually exhausts its self and moves in your direction.
The duration that you hold for is based on the time period you feel like trading.
Eventually you will more than make up your losses if you TRY to hold for 80 pips or more.


"...how do you know when price has hit a new daily high/low? It is easy to see in historical data but not easy to determine real time. If price starts going down starting a midnight and keeps going, technically every new candle is a new daily low."

TRO2009_MPMM_PIPCHANGE_HL

If you missed the yearly highest then you would favor monthly highs over monthly lows.
If you missed the monthly highest then you would favor daily highs over daily lows.
If you missed the daily highest then you would favor 4hr highs over 4hr lows.

If you believe that the lows have reached a technically significant level then you could reverse this bias.

That said...

I pretty much just look at the Daily, Weekly, Monthly, & Yearly chart and say to myself:

1. This is my plan for accomplishing my short term goals
2. This is my plan for accomplishing any longer term goals
3. These are areas that I want to watch and see how price reacts because I may be interested in taking this chart back in the opposite direction.

It is just a lot of guessing mixed with a lot of doing...

-------------------------

Please add www.kreslik.com to your ad blocker white list.
Thank you for your support.


Return to “TheRumpledOne”