MO's MBT Micro

free & uncensored discussion arena for TheRumpledOne

Moderator: moderators

User avatar
MightyOne
rank: 5000+ posts
rank: 5000+ posts
Posts: 6055
Joined: Wed Dec 10, 2008 6:33 pm
Reputation: 560
Gender: Male

Postby MightyOne » Fri Jan 08, 2010 8:10 am

If the daily had 3 or 4 start times (every 6 or 8 hours) and expired 24 hours later...

Or they could offer 2 day binary options spaced 20 pips and that would be grand also.

The strike width for the weekly binary are too fergin wide, but it is your only real option :roll:


Spot it is then...

Please add www.kreslik.com to your ad blocker white list.
Thank you for your support.

Brookmyre
rank: 150+ posts
rank: 150+ posts
Posts: 196
Joined: Wed Sep 16, 2009 11:13 pm
Reputation: 7
Gender: Male

Postby Brookmyre » Sun Jan 10, 2010 3:56 am

Hey Guys, I've set my Fibo tool to show 1/6s but I was wondering if someone could please explain how to display the currency price on the 1/6 lines. Thanks!
I've learned from my mistakes and I'm sure I can repeat them exactly - Peter Cook

Gyro_1
rank: <50 posts
rank: <50 posts
Posts: 8
Joined: Wed Oct 29, 2008 11:58 am
Reputation: 0
Gender: Male

Postby Gyro_1 » Sun Jan 10, 2010 11:49 am

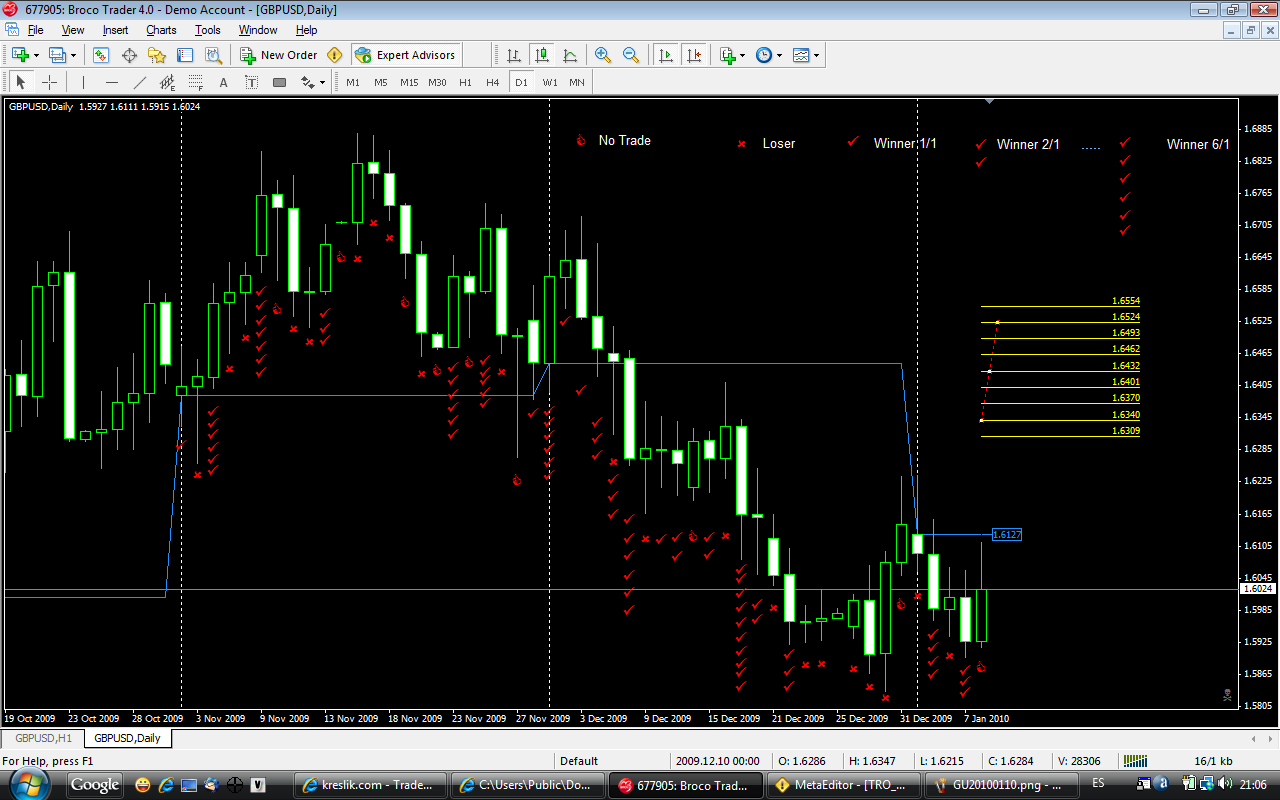
Brookmyre wrote:Hey Guys, I've set my Fibo tool to show 1/6s but I was wondering if someone could please explain how to display the currency price on the 1/6 lines. Thanks!


Hi Brookmyre
go to the fibo levels tab in properties
then in the description type: %$
this should give you the price levels
you can also add text if you want
good luck
Gyro

Brookmyre
rank: 150+ posts
rank: 150+ posts
Posts: 196
Joined: Wed Sep 16, 2009 11:13 pm
Reputation: 7
Gender: Male

Postby Brookmyre » Sun Jan 10, 2010 1:26 pm

Awesome Gyro, thankyou. Big help.
I've learned from my mistakes and I'm sure I can repeat them exactly - Peter Cook

frang0nve
rank: 150+ posts
rank: 150+ posts
Posts: 198
Joined: Thu Apr 09, 2009 7:57 pm
Reputation: 0
Gender: Male

Postby frang0nve » Sun Jan 10, 2010 8:25 pm

Hello,

I've being manually backtesting (I hope I didn't make too many mistakes) the 1/6 strategy (average range of two prior candles) with daily candles and trading in direction of the monthly candle.

These are the results:

Image

50 Trading days
42 Trades
21 Losers
21 Winners (At less 1/1 Profit)
5 Winners 1/1
3 Winners 2/1
5 Winners 3/1
1 Winner 4/1
1 Winner 5/1
4 Winners 6/1
1 Winner 7/1
1 Winner 10/1

Cheers

Francisco

Please add www.kreslik.com to your ad blocker white list.
Thank you for your support.

User avatar
Braathen
rank: 500+ posts
rank: 500+ posts
Posts: 615
Joined: Mon Jul 20, 2009 6:21 pm
Reputation: 15
Location: Infront of the PC O_o
Gender: Male

Postby Braathen » Mon Jan 11, 2010 12:32 am

Didnt know where to post this .. nla is choppy so i hope u dont mind me posting a few things MO.. if u do you know where to flame meh ;)
So completly back to basics for me. This is my interpretation of recent GU activity... looks like ive been overthinking this all along.. total basics i know and prob a waste of posting space but any comments would be appriciated .. Its the build up to fridays nfp news.. Hit the low area from the christmas/newyear move.. simple 15m chart with 1hour candles layover. 1 = body in the direction of profit. 2 = wick in the direction of loss.
first one was iffy imo but the second 1h 1,2 was nice and the 15m to confirm holding

Image

Maybe someone who traded this could give there story.
"Trading is the ability to see & to plan & to act; it is not crystal balls, precision entries, and ego stroking."
MO-

User avatar
leonyde
rank: <50 posts
rank: <50 posts
Posts: 49
Joined: Wed Jun 24, 2009 1:11 pm
Reputation: 0
Location: Here
Gender: None specified

Postby leonyde » Mon Jan 11, 2010 2:09 pm

frang0nve wrote:Hello,

I've being manually backtesting (I hope I didn't make too many mistakes) the 1/6 strategy (average range of two prior candles) with daily candles and trading in direction of the monthly candle.

These are the results:

Image

50 Trading days
42 Trades
21 Losers
21 Winners (At less 1/1 Profit)
5 Winners 1/1
3 Winners 2/1
5 Winners 3/1
1 Winner 4/1
1 Winner 5/1
4 Winners 6/1
1 Winner 7/1
1 Winner 10/1

Cheers

Francisco


I don't think your results are exactly accurate. I think you are watching things after they already happened. To be valid you should analyse the formation of the new low/high, at least on H1 I would say. Personally I would go down to M5 or M1 to be more accurate. As at any point we don't really know what the extrem will be, this is the main (and only?) difficulty here.

The whole point of dividing the range by 6 is to quantify the current move, to know easily where price currently is, and what to possibly expect (in comparison to the previous average range). At least this is how I use it.

User avatar
leonyde
rank: <50 posts
rank: <50 posts
Posts: 49
Joined: Wed Jun 24, 2009 1:11 pm
Reputation: 0
Location: Here
Gender: None specified

Postby leonyde » Mon Jan 11, 2010 2:23 pm

MightyOne wrote:If the daily had 3 or 4 start times (every 6 or 8 hours) and expired 24 hours later...

Or they could offer 2 day binary options spaced 20 pips and that would be grand also.

The strike width for the weekly binary are too fergin wide, but it is your only real option :roll:


Spot it is then...


The price of binaries (on IGM) seem to be higly influenced by people buying / selling them, more than the price move in itself. It is funny to observe how the price of an option can fluctuate along with what people think. People are not always right, I think there are sometime the options we want at an affordable price. Rare, but possible. Last friday I bought some good option with a RR of almost 1:1.5 (wow!)...

And what about buying something which is very likely to happen, with a risk 2 or 3 times higher than the reward? On IGM I feel particularly interested by the Up/Down candles. Can we say that at some point the color of one candle is not likely to change? I have to run some serious stats to see if we can have an edge here. I made some good *gamgles* last week with AUDUSD and USDJPY... My thinking behind that was that after the market close in the Asian markets, the liquidity "should" diminish in those currency. But as I said, Im just gambling here, I did not run any good stats to prove anything.

Brookmyre
rank: 150+ posts
rank: 150+ posts
Posts: 196
Joined: Wed Sep 16, 2009 11:13 pm
Reputation: 7
Gender: Male

Postby Brookmyre » Wed Jan 13, 2010 9:36 pm

Mo, when using mfar, are you using anything else other than the h6/d1 h8/w1 to determine direction? Other than it passing the correct line, of course :)


edit
I've learned from my mistakes and I'm sure I can repeat them exactly - Peter Cook

User avatar
MightyOne
rank: 5000+ posts
rank: 5000+ posts
Posts: 6055
Joined: Wed Dec 10, 2008 6:33 pm
Reputation: 560
Gender: Male

Postby MightyOne » Thu Jan 14, 2010 2:23 am

I am not ignoring anyone, I have been busy with family and friends.

My baby sister had her baby today btw :P

Feel free to post about anything and I will start answering in the near future :wink:

PS: I have been using the range of the 2nd largest of the last 3 candles as the range for division; averages have been giving me numbers that are either too large or too small.

Another thing I do is wait for the entry candle to close and then liquidate shortly after breakout (hopefully there is a BO).

What else...

I've been trading smaller position sizes on the first entry and reversing with a full position if stopped + other small adjustments based on what I see working.

I just

buy if price is going up

sell if price is going down

&

reverse instead of exiting.


Don't feel like you have to do things as I am doing them.

These adjustments were made on the weekly charts NOT small time frame charts like the 8 hour ;)

Please add www.kreslik.com to your ad blocker white list.
Thank you for your support.


Return to “TheRumpledOne”