Never Lose Again

free & uncensored discussion arena for TheRumpledOne

Moderator: moderators

User avatar
MightyOne
rank: 5000+ posts
rank: 5000+ posts
Posts: 6055
Joined: Wed Dec 10, 2008 6:33 pm
Reputation: 561
Gender: Male

Postby MightyOne » Sun Jun 14, 2009 4:45 am

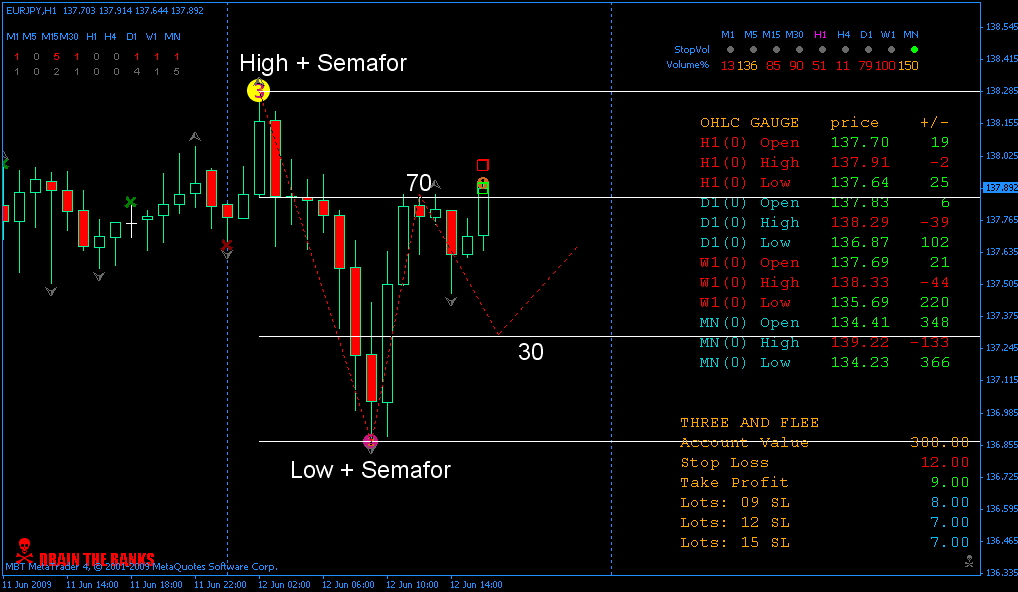
"And, you said 'I am entering off the daily extremes or 70-30', can you gently clarify about 70/30 level." -Inzider


Am I really that mean?!?

ImageImage

Please add www.kreslik.com to your ad blocker white list.
Thank you for your support.

User avatar
MightyOne
rank: 5000+ posts
rank: 5000+ posts
Posts: 6055
Joined: Wed Dec 10, 2008 6:33 pm
Reputation: 561
Gender: Male

Postby MightyOne » Sun Jun 14, 2009 4:59 am

Last few days on this section of the chart were high Semafor followed by a major decline until we arrived at this section:

Image

User avatar
MightyOne
rank: 5000+ posts
rank: 5000+ posts
Posts: 6055
Joined: Wed Dec 10, 2008 6:33 pm
Reputation: 561
Gender: Male

Postby MightyOne » Sun Jun 14, 2009 5:02 am

Notice that beautiful "8" Semafor followed by a roller coaster decline in the above post :shock:

User avatar
prochargedmopar
rank: 10000+ posts
rank: 10000+ posts
Posts: 12073
Joined: Sat Dec 20, 2008 6:07 am
Reputation: 1790
Location: Granbury, TX
Gender: Male
Contact:

Postby prochargedmopar » Sun Jun 14, 2009 5:22 am

Your right TRO,
Charts meaning:
What I use as a reference point for making decisions on price action.

But, me blowing my account back to square one had nothing to do with the chart I was looking at.
I blew my account. I could have easily stopped when I was up 27 pips or when I was down 30. I chose to lose 200+ pips on two different days in one week with a very high pip value to account balance ratio.
Not the chart.

It's more like, pick one indicator to use and then become a master of that one indicator.

Everything works if you keep your eyes open.
You know that.
#1BODY in direction of profit #2INCREASE lot size Obsessively
My Losses cause me Great Laughter!
Trading Bible here> therumpledone/the-ideas-that-i-trade-by-t3256/page1670

User avatar
MightyOne
rank: 5000+ posts
rank: 5000+ posts
Posts: 6055
Joined: Wed Dec 10, 2008 6:33 pm
Reputation: 561
Gender: Male

Postby MightyOne » Sun Jun 14, 2009 7:23 am

I clearly see your potential to become a great scalper PRO.

Your trigger finger is :smt068 :smt044

You're fearless

And when you add discipline into the mix then you are unstoppable Mark-01_Smile

prochargedmopar wrote:Your right TRO,
Charts meaning:
What I use as a reference point for making decisions on price action.

But, me blowing my account back to square one had nothing to do with the chart I was looking at.
I blew my account. I could have easily stopped when I was up 27 pips or when I was down 30. I chose to lose 200+ pips on two different days in one week with a very high pip value to account balance ratio.
Not the chart.

It's more like, pick one indicator to use and then become a master of that one indicator.

Everything works if you keep your eyes open.
You know that.

Please add www.kreslik.com to your ad blocker white list.
Thank you for your support.

teoman
rank: 50+ posts
rank: 50+ posts
Posts: 88
Joined: Tue May 05, 2009 4:11 pm
Reputation: 0
Gender: Male

Postby teoman » Sun Jun 14, 2009 7:44 am

I optimize my method getting better quick scalping...

When Semafor 3 appears , waiting ma cross is profitable unless new highs has not happened, when you are at short position.


How I optimize...

Dont go agains the Laguerre DMI trend.

When you DMI is up, just choose below semafors with MA cross,quit (TP) with any opoosite semafor.

I have not checked the cross semafors yet...


Image
Last edited by teoman on Sun Jun 14, 2009 7:52 am, edited 1 time in total.

teoman
rank: 50+ posts
rank: 50+ posts
Posts: 88
Joined: Tue May 05, 2009 4:11 pm
Reputation: 0
Gender: Male

Postby teoman » Sun Jun 14, 2009 7:49 am

Attached DMI indi. and tpl...
Attachments
teofastscalping.zip
(26.88 KiB) Downloaded 373 times

User avatar
TheRumpledOne
rank: 10000+ posts
rank: 10000+ posts
Posts: 15741
Joined: Sun May 14, 2006 9:31 pm
Reputation: 3046
Location: Oregon
Real name: Avery T. Horton, Jr.
Gender: None specified
Contact:

Postby TheRumpledOne » Sun Jun 14, 2009 5:09 pm

Image

It's beginning to look like all that is needed is the 3 Level ZZ Semafor, Stopping Volume and a daily low/high plot.

When you get a semafor and a stopping volume "X" within one bar of each other, it looks like the reversal is ON!

Remember, indicators are just FILTERS because price and volume are INPUTS.

It's like adding a filter to a camera lens, you change or distort the image. Also, remember, some filters REMOVE light rather than change what is there.
IT'S NOT WHAT YOU TRADE, IT'S HOW YOU TRADE IT!

Please do NOT PM me with trading or coding questions, post them in a thread.

User avatar
MightyOne
rank: 5000+ posts
rank: 5000+ posts
Posts: 6055
Joined: Wed Dec 10, 2008 6:33 pm
Reputation: 561
Gender: Male

Postby MightyOne » Sun Jun 14, 2009 6:12 pm

The chart is so clean and yet so very powerful BlackEye_Smile

The new dashboard is amazing!


Image

User avatar
jahjahblessed
rank: 50+ posts
rank: 50+ posts
Posts: 59
Joined: Wed Feb 11, 2009 6:42 pm
Reputation: 0
Gender: None specified

Postby jahjahblessed » Mon Jun 15, 2009 10:47 am

TheRumpledOne wrote:Image

It's beginning to look like all that is needed is the 3 Level ZZ Semafor, Stopping Volume and a daily low/high plot.

When you get a semafor and a stopping volume "X" within one bar of each other, it looks like the reversal is ON!

Remember, indicators are just FILTERS because price and volume are INPUTS.

It's like adding a filter to a camera lens, you change or distort the image. Also, remember, some filters REMOVE light rather than change what is there.


A POWERFUL TOOL
transform to PIP"S FARI

Whatever the mind of man can conceive and believe, it can achieve.
Napoleon Hill

Image
JAHJAHBLESSED

Please add www.kreslik.com to your ad blocker white list.
Thank you for your support.


Return to “TheRumpledOne”