Never Lose Again

free & uncensored discussion arena for TheRumpledOne

Moderator: moderators

User avatar
TheRumpledOne
rank: 10000+ posts
rank: 10000+ posts
Posts: 15556
Joined: Sun May 14, 2006 9:31 pm
Reputation: 3035
Location: Oregon
Real name: Avery T. Horton, Jr.
Gender: None specified
Contact:

Postby TheRumpledOne » Sun Jun 14, 2009 5:09 pm

Image

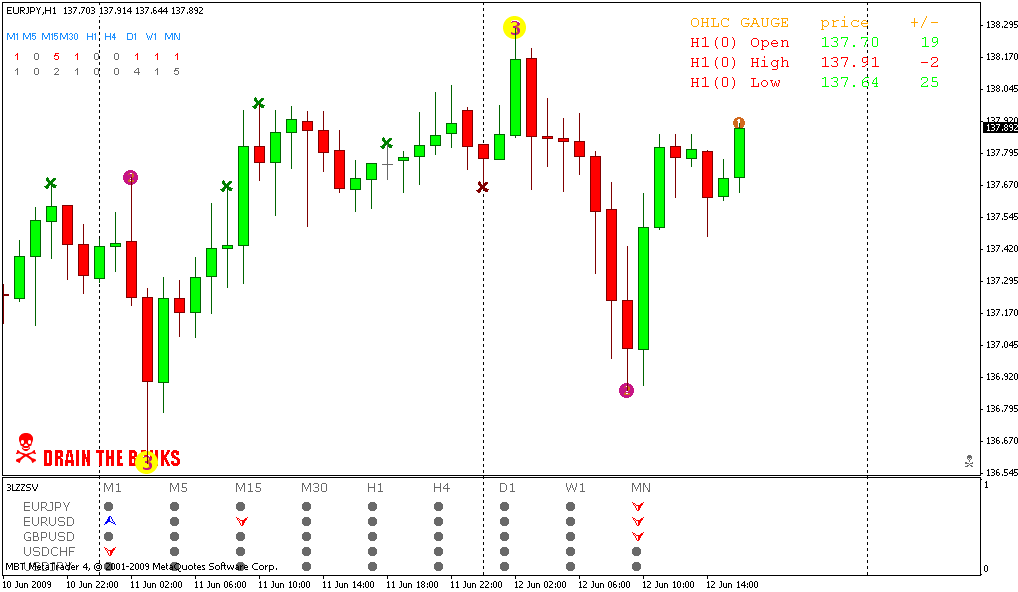
It's beginning to look like all that is needed is the 3 Level ZZ Semafor, Stopping Volume and a daily low/high plot.

When you get a semafor and a stopping volume "X" within one bar of each other, it looks like the reversal is ON!

Remember, indicators are just FILTERS because price and volume are INPUTS.

It's like adding a filter to a camera lens, you change or distort the image. Also, remember, some filters REMOVE light rather than change what is there.
IT'S NOT WHAT YOU TRADE, IT'S HOW YOU TRADE IT!

Please do NOT PM me with trading or coding questions, post them in a thread.

Please add www.kreslik.com to your ad blocker white list.
Thank you for your support.

User avatar
MightyOne
rank: 5000+ posts
rank: 5000+ posts
Posts: 6055
Joined: Wed Dec 10, 2008 6:33 pm
Reputation: 560
Gender: Male

Postby MightyOne » Sun Jun 14, 2009 6:12 pm

The chart is so clean and yet so very powerful BlackEye_Smile

The new dashboard is amazing!


Image

User avatar
jahjahblessed
rank: 50+ posts
rank: 50+ posts
Posts: 59
Joined: Wed Feb 11, 2009 6:42 pm
Reputation: 0
Gender: None specified

Postby jahjahblessed » Mon Jun 15, 2009 10:47 am

TheRumpledOne wrote:Image

It's beginning to look like all that is needed is the 3 Level ZZ Semafor, Stopping Volume and a daily low/high plot.

When you get a semafor and a stopping volume "X" within one bar of each other, it looks like the reversal is ON!

Remember, indicators are just FILTERS because price and volume are INPUTS.

It's like adding a filter to a camera lens, you change or distort the image. Also, remember, some filters REMOVE light rather than change what is there.


A POWERFUL TOOL
transform to PIP"S FARI

Whatever the mind of man can conceive and believe, it can achieve.
Napoleon Hill

Image
JAHJAHBLESSED

rickyineng
rank: <50 posts
rank: <50 posts
Posts: 25
Joined: Tue Sep 23, 2008 9:35 pm
Reputation: 0
Location: Dorset
Gender: Male
Contact:

Postby rickyineng » Mon Jun 15, 2009 2:37 pm

Hi TRO,

What are the exact names (?.mq4) of those indicators on your charts?


Thank you.

Best Regards,
-- Ricky

TheRumpledOne wrote:Image

It's beginning to look like all that is needed is the 3 Level ZZ Semafor, Stopping Volume and a daily low/high plot.

When you get a semafor and a stopping volume "X" within one bar of each other, it looks like the reversal is ON!

Remember, indicators are just FILTERS because price and volume are INPUTS.

It's like adding a filter to a camera lens, you change or distort the image. Also, remember, some filters REMOVE light rather than change what is there.

User avatar
MightyOne
rank: 5000+ posts
rank: 5000+ posts
Posts: 6055
Joined: Wed Dec 10, 2008 6:33 pm
Reputation: 560
Gender: Male

Postby MightyOne » Mon Jun 15, 2009 6:23 pm

If you are willing :lol:

Could Sweet Spot Gold be modified to only plot the lines from the prev. bar to the following bar so we can keep the rest of the chart clean:

Image

Please add www.kreslik.com to your ad blocker white list.
Thank you for your support.

User avatar
blubbb
rank: 150+ posts
rank: 150+ posts
Posts: 219
Joined: Mon Sep 29, 2008 8:07 pm
Reputation: 0
Location: Europe
Gender: Male

Postby blubbb » Mon Jun 15, 2009 7:53 pm

My Blubbb_PsychAlert does this (only the nearest psych lines; and reads the pip distance out aloud so you can trade blind *g*).

maciekkov
rank: <50 posts
rank: <50 posts
Posts: 18
Joined: Fri Jun 05, 2009 11:29 am
Reputation: 0
Gender: None specified

Postby maciekkov » Mon Jun 15, 2009 8:33 pm

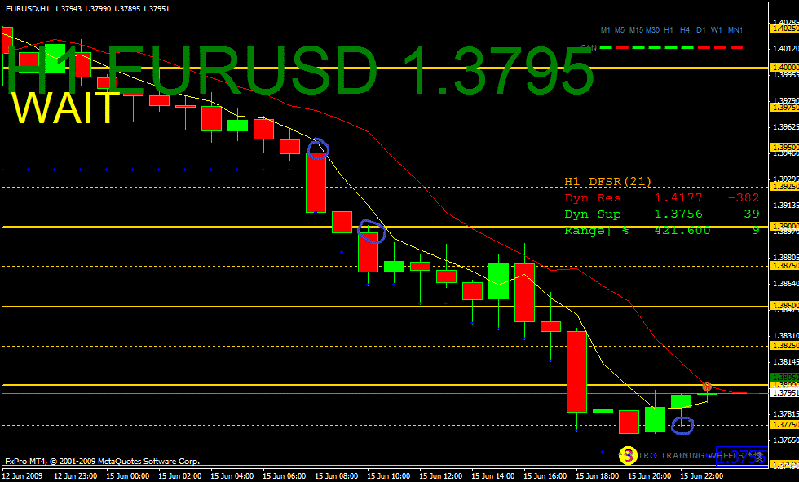
im entry in blue circle: / why im lose? candle cross line.
Image

User avatar
prochargedmopar
rank: 10000+ posts
rank: 10000+ posts
Posts: 12048
Joined: Sat Dec 20, 2008 6:07 am
Reputation: 1790
Location: Granbury, TX
Gender: Male
Contact:

Postby prochargedmopar » Mon Jun 15, 2009 9:42 pm

Will someone please explain the 3LZZSV dashboard?
Does it signal when an X pops up?
Or is it a combination of an X and a Semafor?

How bout having a 3LZZ dashboard that places the "x" over the top of the semafor dots when they pop in combination.

Thanks.
#1BODY in direction of profit #2INCREASE lot size Obsessively
My Losses cause me Great Laughter!
Trading Bible here> therumpledone/the-ideas-that-i-trade-by-t3256/page1670

User avatar
prochargedmopar
rank: 10000+ posts
rank: 10000+ posts
Posts: 12048
Joined: Sat Dec 20, 2008 6:07 am
Reputation: 1790
Location: Granbury, TX
Gender: Male
Contact:

Postby prochargedmopar » Mon Jun 15, 2009 9:53 pm

Why?
Your basic price analysis is wrong.

Look at the trend. Price is higher at the left of the screen than the right.
Trade short.

Don't feel bad, I continually try to pick tops and bottoms.
When you are wrong you have to admit it and get out Immediately or get buried. When trading with the trend it's a little more forgiving.
#1BODY in direction of profit #2INCREASE lot size Obsessively
My Losses cause me Great Laughter!
Trading Bible here> therumpledone/the-ideas-that-i-trade-by-t3256/page1670

maciekkov
rank: <50 posts
rank: <50 posts
Posts: 18
Joined: Fri Jun 05, 2009 11:29 am
Reputation: 0
Gender: None specified

Postby maciekkov » Tue Jun 16, 2009 12:58 am

I noticed something when H1 candle created very often price trying to fool us than price revers and going with good directions.I mean that red candle first create max then low finaly close , green candel first created low than max and close.look at the picture.blue circles means cheating.I think good??so we can play when price revers on H1:)
Image

Please add www.kreslik.com to your ad blocker white list.
Thank you for your support.


Return to “TheRumpledOne”