Am I really that mean?!?

Moderator: moderators


.gif "Mark-01")
prochargedmopar wrote:Your right TRO,
Charts meaning:
What I use as a reference point for making decisions on price action.
But, me blowing my account back to square one had nothing to do with the chart I was looking at.
I blew my account. I could have easily stopped when I was up 27 pips or when I was down 30. I chose to lose 200+ pips on two different days in one week with a very high pip value to account balance ratio.
Not the chart.
It's more like, pick one indicator to use and then become a master of that one indicator.
Everything works if you keep your eyes open.
You know that.


TheRumpledOne wrote:
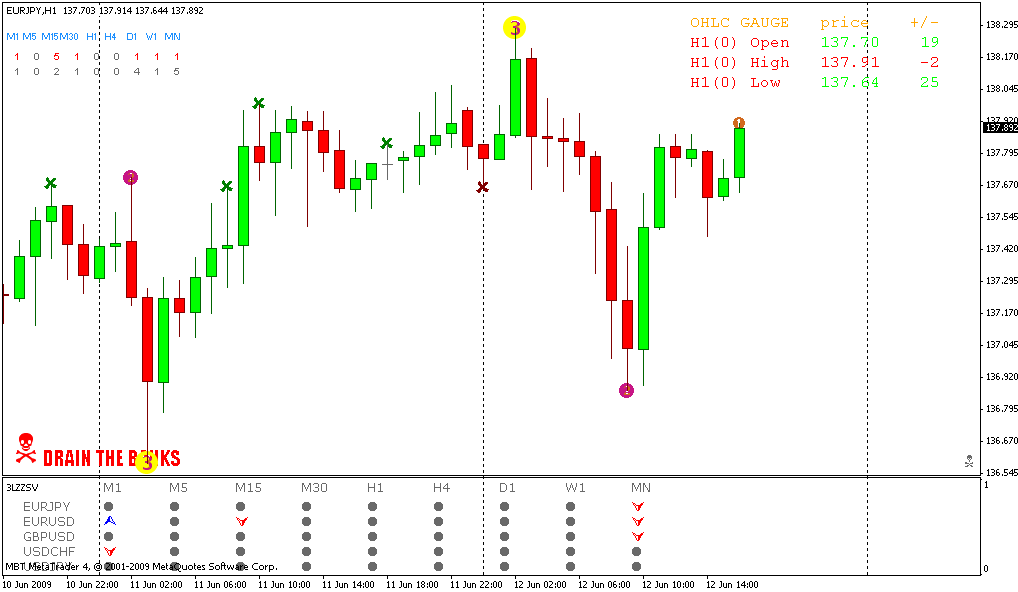
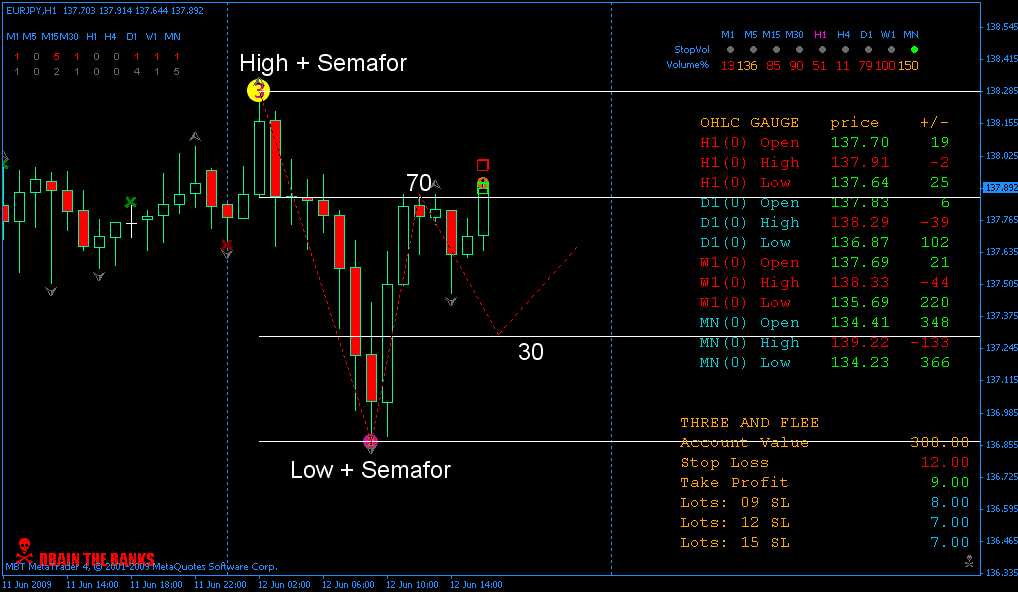
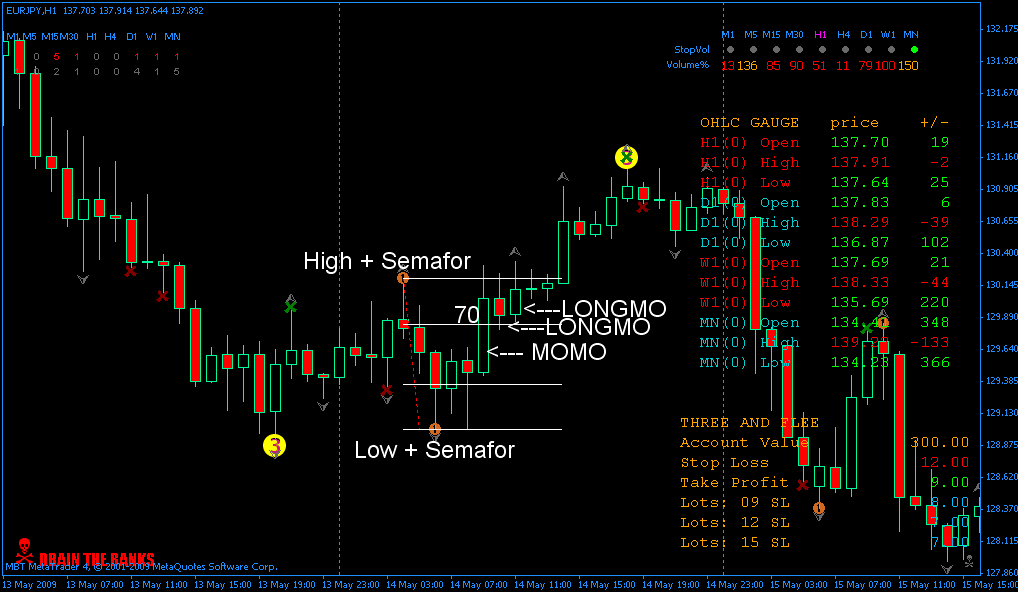
It's beginning to look like all that is needed is the 3 Level ZZ Semafor, Stopping Volume and a daily low/high plot.
When you get a semafor and a stopping volume "X" within one bar of each other, it looks like the reversal is ON!
Remember, indicators are just FILTERS because price and volume are INPUTS.
It's like adding a filter to a camera lens, you change or distort the image. Also, remember, some filters REMOVE light rather than change what is there.

.gif "BlackEye")