Postby cpamom » Tue Apr 28, 2009 10:14 pm
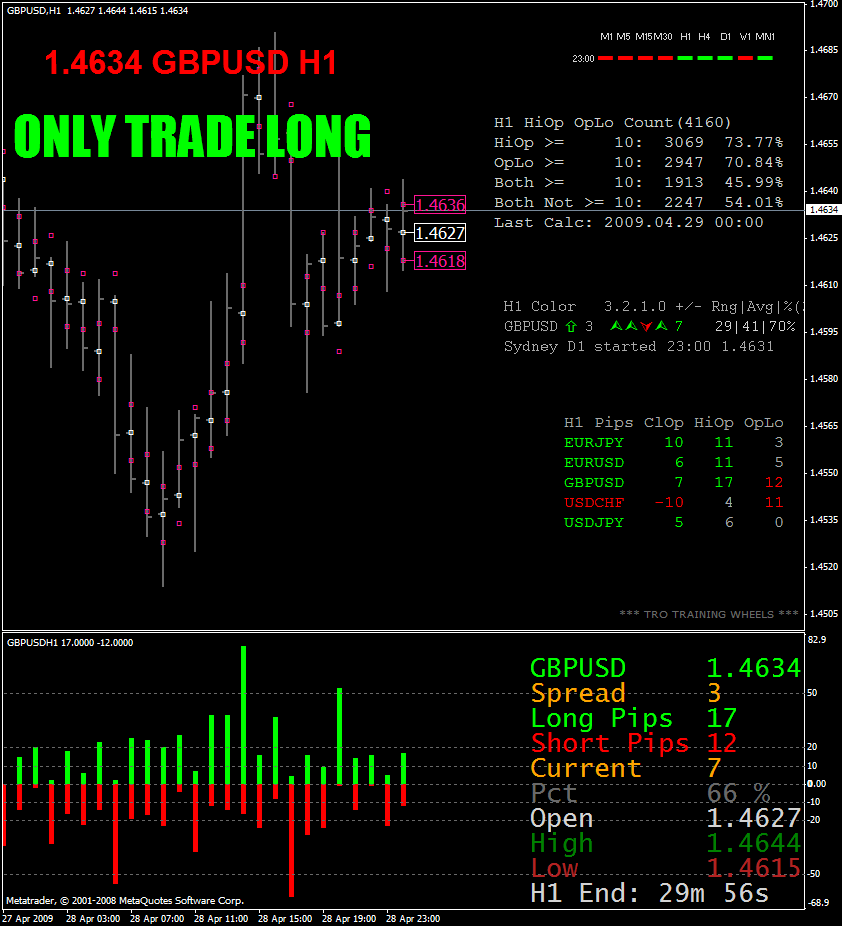
Dumped the Open/High/Low/Close of the last 4,160 G/U bars and crunched some numbers. Had the spreadsheets already build as I've been analyzing daily high and low breakouts. Here's the breakdown...
Out of 4,160 bars, 1,199 (28.82%) moved up 10+ pips from open, 1,077 (25.89%) went down 10+ pips, 68 (1.63%) didn't hit 10+ either way, 1,816 (43.65 %) hit it both directions.
For those bars hitting the O(Open)+10 mark on the upside only, the average move up was 46.64 pips. For those hitting O-10 on the downside only, the average move down was 49.09 pips. When both sides hit, the average up move was 34.88 pips and down was 35.81 pips. As you can see, average hourly move is higher when the +/-10 mark only hits one direction and not the other, averages decline when both directions are hit.
Profit potential (I'm a scalper so I tested for 5 pips profit)...of the 1,199 hitting only on the move up, 1,038 (86.57%) hit at least O+19 up leaving a 5 pip scalp profit w/ a 4 pip spread if you entered at +10. For the move down, out of 1,077, 911 (84.59%) went to the O-19 mark.
When 10 pip mark is hit both directions, 1,236 of 1,816 (68.06%) of the upside moves go to the O+19 mark, and 1,294 of the 1,816 (71.26%) of the downside moves go to the O-19 mark. As with averages above, percentages moving to +/-19 pips are lower when mark is hit both ways.
Back later with more stats....tro is begging for a post.


