Daily analysis from FXOpen

forex live trades, setups, charts

Moderator: moderators

User avatar
whiteking
rank: 150+ posts
rank: 150+ posts
Posts: 350
Joined: Fri Aug 11, 2017 2:25 am
Reputation: 32
Gender: None specified

Re: Daily analysis from FXOpen

Postby whiteking » Thu Aug 17, 2023 12:27 pm

Market Analysis: XRP/USD Price Rolls Back to Important Support
Image

July was marked by the end of the trial between the SEC regulator and Ripple Labs in favor of the latter, which led to a sharp increase in the XRP token to a price above USD 0.9, but then a rollback followed after the first emotional reaction.

By the way, the trial is not completed yet. As it became known, the SEC intends to appeal the court's decision.
Image

Bearish arguments:
-> The price of the XRP token may fall after the SEC formally files an appeal.
-> The price of the XRP token has rolled back by more than 2/3 from the July rapid growth — this is too deep a size for a normal correction.

Bullish arguments:
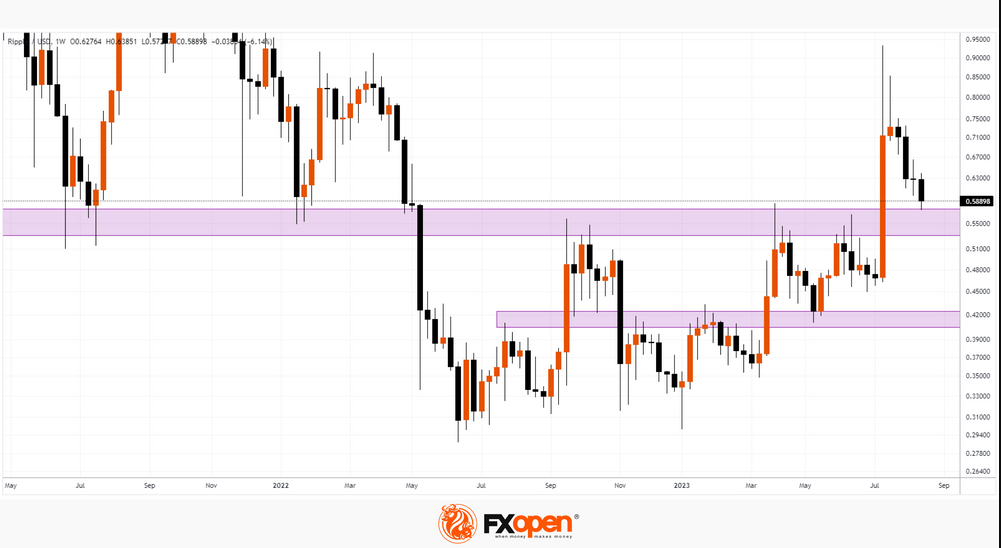
-> The price dropped to the important support zone 0.530 – 0.575, which repeatedly affected the price dynamics of the XRP token in 2021-2023.
-> Long lower shadows on the intraday XRP/USD charts may indicate that the support effect from this zone has already begun. Similar reversals can be observed, by the way, in a similar zone 0.404 – 0.424.


This article represents the opinion of the Companies operating under the FXOpen brand only. It is not to be construed as an offer, solicitation, or recommendation with respect to products and services provided by the Companies operating under the FXOpen brand, nor is it to be considered financial advice.
I trade at FXOpen

Please add www.kreslik.com to your ad blocker white list.
Thank you for your support.

User avatar
whiteking
rank: 150+ posts
rank: 150+ posts
Posts: 350
Joined: Fri Aug 11, 2017 2:25 am
Reputation: 32
Gender: None specified

Re: Daily analysis from FXOpen

Postby whiteking » Fri Aug 18, 2023 11:58 am

Market Analysis: Gold Price and Crude Oil Price Signal Negative Trend
Image

Gold price is moving lower from the $1,930 resistance. Crude oil price is also declining and showing bearish signs below $80.00.

Important Takeaways for Gold and Oil Prices Analysis Today
  • Gold price failed to clear the 1,930 resistance and moved lower against the US Dollar.
  • A major bearish trend line is forming with resistance near $1,895 on the hourly chart of gold at FXOpen.
  • Crude oil prices are also moving lower below the $80.00 resistance zone.
  • There is a key bearish trend line forming with resistance near $80.00 on the hourly chart of XTI/USD at FXOpen.

Gold Price Technical Analysis

On the hourly chart of Gold at FXOpen, the price struggled to settle above the $1,930 resistance. The price started a fresh decline below the $1,920 pivot level.

The price traded below the $1,900 support and the 50-hour simple moving average. It tested the $1,885 zone. A low is formed near $1,885 and the price is now consolidating losses. It is now testing the 50% Fib retracement level of the downward move from the $1,903 swing high to the $1,885 low.

Image

There is also a major bearish trend line forming with resistance near $1,895 and the 50-hour simple moving average. The next major resistance is near the 76.4% Fib retracement level of the downward move from the $1,903 swing high to the $1,885 low at $1,900.

An upside break above the $1,900 resistance could send Gold price toward $1,910. Any more gains may perhaps set the pace for an increase toward the $1,930 level.

Initial support on the downside is near the $1,885 level. The first major support is near the $1,875 level. If there is a downside break below the $1,875 support, the price might decline further. In the stated case, the price might drop toward the $1,850 support.

This article represents the opinion of the Companies operating under the FXOpen brand only. It is not to be construed as an offer, solicitation, or recommendation with respect to products and services provided by the Companies operating under the FXOpen brand, nor is it to be considered financial advice.
I trade at FXOpen

User avatar
whiteking
rank: 150+ posts
rank: 150+ posts
Posts: 350
Joined: Fri Aug 11, 2017 2:25 am
Reputation: 32
Gender: None specified

Re: Daily analysis from FXOpen

Postby whiteking » Mon Aug 21, 2023 1:54 pm

Market Analysis: GBP/USD Consolidates While EUR/GBP Takes Hit
Image

GBP/USD is attempting a recovery wave above the 1.2700 resistance. EUR/GBP declined heavily below the 0.8600 and 0.8565 support levels.

Important Takeaways for GBP/USD and EUR/GBP Analysis Today

  • The British Pound is attempting a fresh increase above 1.2700.
  • There is a key contracting triangle forming with resistance near 1.2740 on the hourly chart of GBP/USD at FXOpen.
  • EUR/GBP is trading in a bearish zone below the 0.8565 pivot level.
  • There is a major bearish trend line forming with resistance near 0.8545 on the hourly chart at FXOpen.

GBP/USD Technical Analysis

On the hourly chart of GBP/USD at FXOpen, the pair settled below the 1.2800 zone. As mentioned in the previous analysis, the British Pound turned red and extended losses below the 1.2700 pivot level against the US Dollar.

Finally, the pair tested the 1.2620 zone and recently started a recovery wave. There was a decent increase above the 1.2700 pivot level. The pair is now consolidating near the 50-hour simple moving average at 1.2740.

Image

There is also a key contracting triangle forming with resistance near 1.2740. The triangle resistance coincides with the 50% Fib retracement level of the downward move from the 1.2787 swing high to the 1.2689 low.

On the upside, the GBP/USD chart indicates that the pair is facing resistance near 1.2740. The next major resistance is near the 76.4% Fib retracement level of the downward move from the 1.2787 swing high to the 1.2689 low at 1.2765.

A close above the 1.2765 resistance zone could open the doors for a move toward 1.2800. Any more gains might send GBP/USD toward 1.2880.

On the downside, there is a key support forming near 1.2700. If there is a downside break below 1.2700, the pair could accelerate lower. The next major support is near the 1.2665 zone, below which the pair could test 1.2620. Any more losses could lead the pair toward the 1.2550 support.


This article represents the opinion of the Companies operating under the FXOpen brand only. It is not to be construed as an offer, solicitation, or recommendation with respect to products and services provided by the Companies operating under the FXOpen brand, nor is it to be considered financial advice.
I trade at FXOpen

User avatar
whiteking
rank: 150+ posts
rank: 150+ posts
Posts: 350
Joined: Fri Aug 11, 2017 2:25 am
Reputation: 32
Gender: None specified

Re: Daily analysis from FXOpen

Postby whiteking » Tue Aug 22, 2023 1:42 pm

EURUSD Analysis: Price is Forming a Rebound from the Support of 1.085
Image

From the high of the year, set on July 18 near the level of 1.125, the price of EUR/USD fell in 1 month to the support of 1.085 (-3.4%). Today, the EUR/USD chart shows that the market is forming a rebound from this support, which has been in place since mid-June. What will be the further development?

Bullish arguments:
-> The market is in an uptrend (indicated by the blue channel) in 2023 and its lower boundary, which forms a powerful block of support at the level of 1.085, can help the bounce develop into a meaningful swing.
-> Support may come from SMA (100).

Bearish arguments:
-> The higher the price of EUR/USD rises, the closer the level of 1.095 becomes, which acted as support; but after the pin bar on August 10, the level was broken, and now resistance can be expected from it. If this is indeed the case, the market will form a weak bounce from the block of supports in the 1.085 area — a threatening sign for the current ascending channel.

Image

Fundamental background:
-> Tomorrow morning (between 10:15 am and 11:00 am GMT+3) economic data from the Eurozone will be published, including the Purchasing Managers' Index (PMI), which is considered a leading indicator of the state of the economy. Last month, PMI values set multi-month lows, showing a slowdown in the economy in Europe, which led to a fall in the EUR/USD rate (shown by the arrow). It is possible that the market will get a new reason for a bearish momentum.
-> The media are writing about the weakening of the dollar on the eve of the symposium in Jackson Hole, where Powell is scheduled to speak on August 25. If the head of the Fed is clearly leaving the doors open for new rate hikes, this will allow the dollar to strengthen and put pressure on the EUR/USD rate.

This article represents the opinion of the Companies operating under the FXOpen brand only. It is not to be construed as an offer, solicitation, or recommendation with respect to products and services provided by the Companies operating under the FXOpen brand, nor is it to be considered financial advice.
I trade at FXOpen

User avatar
whiteking
rank: 150+ posts
rank: 150+ posts
Posts: 350
Joined: Fri Aug 11, 2017 2:25 am
Reputation: 32
Gender: None specified

Re: Daily analysis from FXOpen

Postby whiteking » Wed Aug 23, 2023 4:10 pm

3 Best Trading Strategies in Forex: Scalping, Swing Trading, Day Trading

In this video, you'll discover 3 strategies that could elevate your Forex trading skills. Explore key factors like timeframe, experience, and balance that shape strategy selection.

Image

Scalping: Swift trades on short timeframes. Leverage Stochastic Oscillator for entry, profit, and stop-loss.

Swing Trading: Versatile trendline strategy. Enter, set targets, and manage risk.

Day Trading: Intraday strategy using RSI. Perfect entry, targets, and stop-loss.

Adapt these strategies to your style on your trading account at FXOpen.


CFDs are complex instruments and come with a high risk of losing your money.
I trade at FXOpen

Please add www.kreslik.com to your ad blocker white list.
Thank you for your support.

User avatar
whiteking
rank: 150+ posts
rank: 150+ posts
Posts: 350
Joined: Fri Aug 11, 2017 2:25 am
Reputation: 32
Gender: None specified

Re: Daily analysis from FXOpen

Postby whiteking » Thu Aug 24, 2023 1:01 pm

Market Analysis: GBP/USD Bounces Back after Falling 1% in One Day
Image

The publication of news on the UK PMI index yesterday signaled an acceleration of the downturn in business activity. The index value was 42.5 (values below 50 indicate a slowdown in the economy). This is the thirteenth consecutive reading of the index below 50, with readings below 42.5 last recorded during the height of the pandemic in the spring of 2020.

The first reaction to the news was a sharp drop in the GBP/USD rate, but by the end of the trading session, the rate recovered, which can be considered evidence of strong demand.

More bullish arguments are given by the analysis of the volumes of trading in futures for the British pound on the CME exchange:
-> the largest trading volumes for the year were recorded on June 13 (more than 240k contracts were traded at an average of about 100k per day). If you draw a horizontal level from the high of this candle at 1.262, you will see how it acts as support;
-> yesterday, extremely high volumes (more than 155k contracts) were recorded again on a candle with a long lower shadow. That is, high volumes, reflecting the activity of large players, may indicate the relevance of demand for the pound at a price of 1.262.

Image

Moreover, the pound is near the lower border of the rising channel.

Bearish arguments:
-> Since mid-July, the GBP/USD rate has shown a bearish trend. And if there is a breakdown of the level of 1.262, where large volumes were noticed, this will be an important confirmation of the superiority of sellers.
-> Fundamentally, the UK economy looks weaker than the rest, including due to higher inflation rates, which makes the prospects for the pound vague.


This article represents the opinion of the Companies operating under the FXOpen brand only. It is not to be construed as an offer, solicitation, or recommendation with respect to products and services provided by the Companies operating under the FXOpen brand, nor is it to be considered financial advice.
I trade at FXOpen

User avatar
whiteking
rank: 150+ posts
rank: 150+ posts
Posts: 350
Joined: Fri Aug 11, 2017 2:25 am
Reputation: 32
Gender: None specified

Re: Daily analysis from FXOpen

Postby whiteking » Fri Aug 25, 2023 12:43 pm

Market Analysis: Is the Price of Natural Gas Forming a New Trend?
Image

The US Energy Information Administration said on Thursday that natural gas inventories in US storage rose by 18 billion cubic feet in the week ended Aug. 18. That was below the 29 billion cubic feet increase forecast by analysts polled by S&P Global Commodity Insights.

It is possible that market participants thought that insufficient filling of storage facilities will lead to a rise in gas prices in the coming winter. According to the forecast of the International Energy Agency (IEA), the price of gas will peak at USD 3.44/MMBtu in December 2023 (approximately +36% from current levels).

The natural gas price chart shows that:
-> in July-August, a series of rising supports was formed;
-> the peak of August is higher than the peak of June, which in turn is higher than the peak of May.
Image

A sequence of higher extremes could indicate that the market is in an uptrend that could bring the price closer to the IEA's price targets. The nearest resistance on this way is the level of 2.78, which in July-August repeatedly influenced the price dynamics.


This article represents the opinion of the Companies operating under the FXOpen brand only. It is not to be construed as an offer, solicitation, or recommendation with respect to products and services provided by the Companies operating under the FXOpen brand, nor is it to be considered financial advice.
I trade at FXOpen

User avatar
whiteking
rank: 150+ posts
rank: 150+ posts
Posts: 350
Joined: Fri Aug 11, 2017 2:25 am
Reputation: 32
Gender: None specified

Re: Daily analysis from FXOpen

Postby whiteking » Mon Aug 28, 2023 12:47 pm

Market Analysis: AUD/USD and NZD/USD Signal Downside Continuation
Image

AUD/USD declined below the 0.6450 and 0.6430 support levels. NZD/USD is also moving lower and might trade below the 0.5900 zone.

Important Takeaways for AUD/USD and NZD/USD Analysis Today

  • The Aussie Dollar started a fresh decline from well above the 0.6480 level against the US Dollar.
  • There was a break below a key bullish trend line with support near 0.6430 on the hourly chart of AUD/USD at FXOpen.
  • NZD/USD declined heavily from the 0.5985 resistance zone.
  • There was a break below a major bullish trend line with support near 0.5945 on the hourly chart of NZD/USD at FXOpen.
AUD/USD Technical Analysis

On the hourly chart of AUD/USD at FXOpen, the pair struggled to clear the 0.6500 zone. The Aussie Dollar started a fresh decline below the 0.6450 support against the US Dollar.

There was a break below a key bullish trend line with support near 0.6430. The pair even settled below 0.6430 and the 50-hour simple moving average. The pair is now showing bearish signs and trading near the last swing low at 0.6410.
Image

On the downside, initial support is near the 1.236 Fib extension level of the upward move from the 0.6411 swing low to the 0.6490 high at 0.6390. If there is a downside break below 0.6390, the pair could extend its decline.

The next support could be the 1.618 Fib extension level of the upward move from the 0.6411 swing low to the 0.6490 high at 0.6365. Any more losses might send the pair toward the 0.6320 support.

On the upside, an immediate resistance is near 0.6430. The next major resistance is near the 50-hour simple moving average at 0.6450, above which the price could rise toward 0.6490. Any more gains might send the pair toward 0.6550.

A close above the 0.6550 level could start another steady increase in the near term. The next major resistance on the AUD/USD chart could be 0.6620.


This article represents the opinion of the Companies operating under the FXOpen brand only. It is not to be construed as an offer, solicitation, or recommendation with respect to products and services provided by the Companies operating under the FXOpen brand, nor is it to be considered financial advice.
I trade at FXOpen

User avatar
whiteking
rank: 150+ posts
rank: 150+ posts
Posts: 350
Joined: Fri Aug 11, 2017 2:25 am
Reputation: 32
Gender: None specified

Re: Daily analysis from FXOpen

Postby whiteking » Tue Aug 29, 2023 12:57 pm

Market Analysis: USD/JPY Rate Updates the High of the Year
Image

Yesterday, USD/JPY hit 146.74 for the first time since November 2022. The rise in the rate is facilitated by the growing gap in the policies of central banks: while the Bank of Japan has kept the rate below zero since 2016, the Fed has been raising rates since the spring of 2022.

Moreover, on Friday, Powell said the Fed is ready to continue to remain tough in the fight against inflation. According to CME's FedWatch tool, there is now a 62% chance of a rate hike at the Fed's November meeting, up from 42% a week earlier.

However, the limiting factor for the USD/JPY rate is the power of the Japanese Ministry of Finance. Last year, when the market was at current levels, the authorities intervened in the foreign exchange market, lowering the rate to 140 yen per US dollar.

The USD/JPY chart shows that:
-> the price continues to move within the ascending channel;
-> on Friday, during Powell's speech, the median line was tested, confirming its influence as a support;
-> former resistance at 144.8 also provides support;
-> if the trend continues, the rate may reach the upper limit of the channel — that is, the psychological mark of 150 yen per US dollar.

Image

However, if we analyze the progress of the bulls when reaching the tops, then we can assume that the bullish momentum is depleted: after all, bullish candles do not have a wide body when they reach the highs, but on the contrary, they shrink. For sure, the strength of buyers is limited by fears of new interventions. Therefore, it is possible that a series of cautious renewal of the highs of the year may be interrupted when the Japanese authorities have their say.

According to analysts at Goldman Sachs, the yen may weaken to 155 per US dollar if the Bank of Japan continues to adhere to its ultra-soft position.

This article represents the opinion of the Companies operating under the FXOpen brand only. It is not to be construed as an offer, solicitation, or recommendation with respect to products and services provided by the Companies operating under the FXOpen brand, nor is it to be considered financial advice.
I trade at FXOpen

User avatar
whiteking
rank: 150+ posts
rank: 150+ posts
Posts: 350
Joined: Fri Aug 11, 2017 2:25 am
Reputation: 32
Gender: None specified

Re: Daily analysis from FXOpen

Postby whiteking » Wed Aug 30, 2023 12:39 pm

Market Analysis: EUR/USD Accelerates Gains from 2.5-month Low
Image

This was facilitated by disappointing data on the US labor market. According to the Bureau of Labor Statistics, the number of new vacancies has fallen sharply: actual — 8.8 million, forecast — 9.4 million new vacancies. The last time the value of the indicator fell below 9 million was in the spring of 2021.

The news came as a big surprise, which sent the dollar index down sharply. Accordingly, USD-denominated shares and gold rose, as well as exchange rates traded against the dollar.
Image

The EUR/USD chart shows that:
-> the price accelerated yesterday's rise from the 2.5-month low set on August 25;
-> the price continues to be supported by the lower line of the rising channel;
-> the price continues to be supported by SMA (100);
-> the presence of bears may appear near the lines of the descending channel (shown in red).

The bulls will consolidate their success if they manage to keep the price of EUR/USD above the level of 1.086, from which resistance can be expected. Decrease in the number of vacancies is a leading indicator of the state of the economy. If market participants receive more signals about the slowdown in the US economy, this could lower the USD against other currencies even more.


This article represents the opinion of the Companies operating under the FXOpen brand only. It is not to be construed as an offer, solicitation, or recommendation with respect to products and services provided by the Companies operating under the FXOpen brand, nor is it to be considered financial advice.
I trade at FXOpen

Please add www.kreslik.com to your ad blocker white list.
Thank you for your support.


Return to “forex”