Daily analysis from FXOpen

forex live trades, setups, charts

Moderator: moderators

User avatar
whiteking
rank: 150+ posts
rank: 150+ posts
Posts: 350
Joined: Fri Aug 11, 2017 2:25 am
Reputation: 32
Gender: None specified

Re: Daily analysis from FXOpen

Postby whiteking » Tue Jul 18, 2023 2:44 pm

EUR/USD PRICE: 17-MONTH MAXIMUM
Image

Last week, the dollar index posted its worst week of 2023 amid news of declining US inflation, which was seen as a motive for easing the Fed's current tight monetary policy. "I think the dollar can stay under selling pressure," Carol Kong, currency strategist at Commonwealth Bank of Australia, told Reuters.

On the other hand, inflation in the Eurozone is not declining as fast. FT writes that some ECB officials consider it necessary to raise the rate several more times after the summer meetings, which supports the euro.

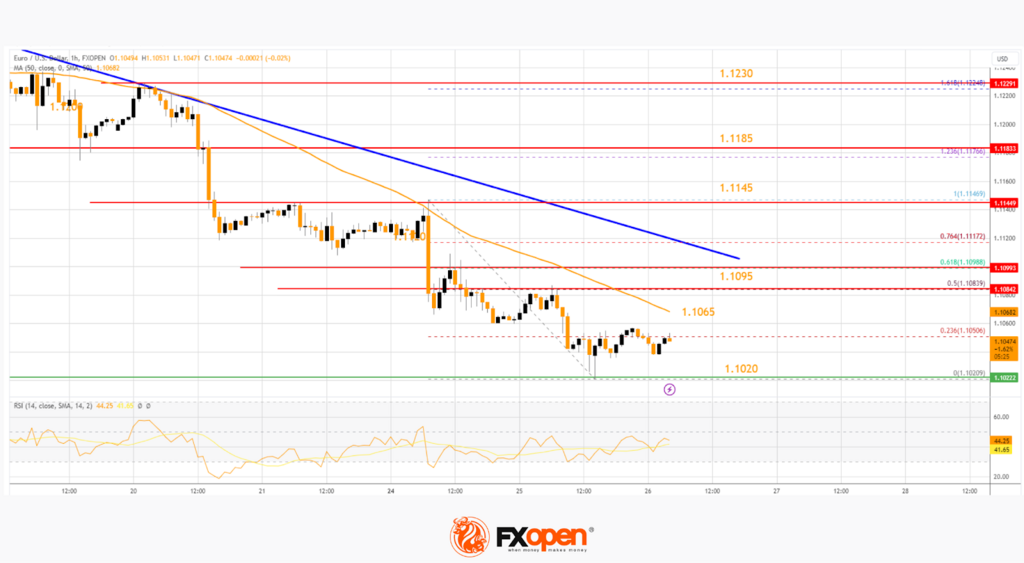
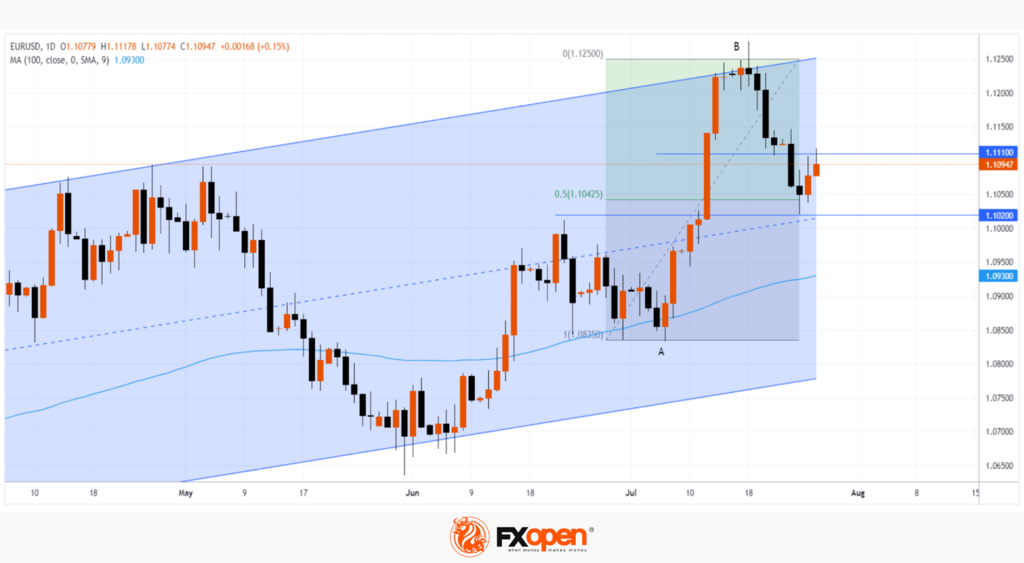
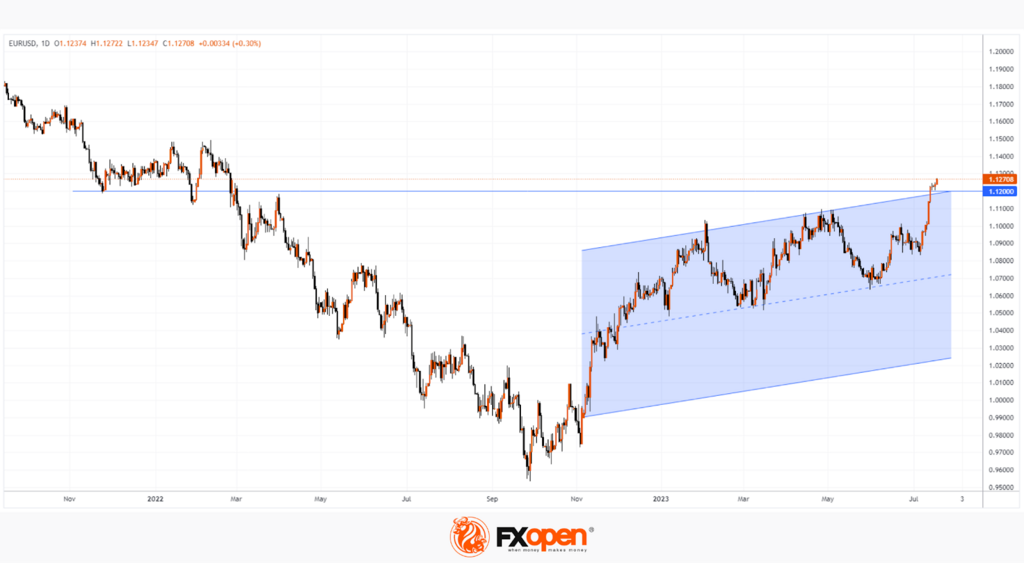
The EUR/USD chart shows demand dominance. At the same time, the price of the euro against the dollar:

rose above the 1.1200 level for the first time in 17 months. Note that this level has influenced the EUR/USD price dynamics in the past;
went beyond the upper limit of the ascending channel.
Given these 2 observations, we can assume that the market is in a vulnerable position for a pullback, and the bulls will need to make specific efforts to gain a foothold above 1.1200.

Image

The situation may change in the near future:
  • US retail sales data to be released today at 15:30 GMT+3;
  • Tomorrow at 12:00 GMT+3 inflation data in the Eurozone will be published.


This article represents the opinion of the Companies operating under the FXOpen brand only. It is not to be construed as an offer, solicitation, or recommendation with respect to products and services provided by the Companies operating under the FXOpen brand, nor is it to be considered financial advice.
I trade at FXOpen

Please add www.kreslik.com to your ad blocker white list.
Thank you for your support.

User avatar
whiteking
rank: 150+ posts
rank: 150+ posts
Posts: 350
Joined: Fri Aug 11, 2017 2:25 am
Reputation: 32
Gender: None specified

Re: Daily analysis from FXOpen

Postby whiteking » Wed Jul 19, 2023 12:55 pm

Market Analysis: Bitcoin Hits July Low
Image

The crypto community continues to discuss the victory of Ripple Labs in court against the SEC, expecting that the regulator:
  • also loses in court against Binance, Coinbase;
  • approves Black Rock's Bitcoin ETF application.
Crypto exchanges are resuming trading in the XRP token, and according to media reports, Congressman Richie Torres has appealed to SEC Chairman Gary Gensler to stop attacking cryptocurrencies.
Image

However, the BTC/USD chart does not show the proper bullish mood, having updated the July low yesterday. Moreover, we can see:
  • bearish engulfing on July 13-14 on the daily chart — a pattern indicating strong selling pressure at the top of the market;
  • slow downward drift after this pattern.

This behaviour of the BTC/USD price may indicate that the bulls cannot take the initiative in the market, despite the positive fundamental background. This should alert those who believe in growth — especially if the price of BTC/USD continues to decline within the channel shown in red.

Disclaimer: This publication represents the News of the Companies operating under the FXOpen brand only. It is not to be construed as an offer, solicitation, or recommendation with respect to products and services provided by the Companies operating under the FXOpen brand, nor is it to be considered financial advice.
I trade at FXOpen

User avatar
whiteking
rank: 150+ posts
rank: 150+ posts
Posts: 350
Joined: Fri Aug 11, 2017 2:25 am
Reputation: 32
Gender: None specified

Re: Daily analysis from FXOpen

Postby whiteking » Thu Jul 20, 2023 1:26 pm

Market Analysis: FTSE 100 Bounces Back on UK Inflation News
Image

Participants in financial markets were closely watching yesterday the data on inflation in the UK, where it is at the highest level among the G7 countries. The news turned out to be positive:
  • CPI was 7.9% (forecast = 8.2%, last month = 8.7%) in annual terms;
  • Core CPI dropped from 31-year high from 7.1% to 6.9%.

Consequently:
  • the price of the British pound fell against the US dollar and other currencies;
  • the price of the FTSE 100 index rose sharply, rising from the July lows by about 5%.
Thus, the quotes demonstrate the expectations of market participants — they suggest that the Bank of England has received a reason to ease the ongoing tight monetary policy aimed at suppressing inflation.

The publication of the decision of the Bank of England is scheduled for August 3, and the interest rate can be raised only by 0.25%, although earlier 0.5% was called more likely.

Image

The sharp rise in the price of the FTSE 100 has led to the fact that the descending channel is broken, as is the resistance level at 7,555. It is possible that after such a sharp impulse, we will witness a consolidation period, which may be limited to the levels of 7,555 and 7,690.


[i]This article represents the opinion of the Companies operating under the FXOpen brand only. It is not to be construed as an offer, solicitation, or recommendation with respect to products and services provided by the Companies operating under the FXOpen brand, nor is it to be considered financial advice.
I trade at FXOpen

User avatar
whiteking
rank: 150+ posts
rank: 150+ posts
Posts: 350
Joined: Fri Aug 11, 2017 2:25 am
Reputation: 32
Gender: None specified

Re: Daily analysis from FXOpen

Postby whiteking » Tue Jul 25, 2023 1:27 pm

BTC/USD Analysis: Breakdown of July Support
Image

Yesterday, the price of BTC/USD fell below the level of 29,700, a support that has been in place for about a month.

What are the reasons for the decline? CNBC writes about:
  • strengthening of the USD on the eve of the Fed's meeting on the interest rate, which puts pressure on the price of bitcoin, denominated in US dollars;
  • an article in the WSJ raising concerns for the crypto industry in light of the pending SEC lawsuit against Binance.

Image

Note that in our previous post, we pointed out a sign of weakness, which manifested itself in the inability of the bulls to take advantage of the positive from Ripple Labs' victory in court with the SEC, and also built a downward channel (shown in red). Yesterday, on the chart, the price of BTC/USD reached its lower limit, where it found support.

Will the price of bitcoin continue to develop dynamics within this channel? A lot depends on the Fed. The decision on the key interest rate will be announced tomorrow at 21:00 GMT+3. And at 21:30 Powell will hold a press conference.

We also draw attention to the fact that:
  • news on the interest rate from the ECB will be released on Thursday at 15:15 GMT+3;
  • on Friday at 06:00 GMT+3, a similar event from the Bank of Japan.
Be prepared for bursts of volatility, including in the BTC/USD market.

This article represents the opinion of the Companies operating under the FXOpen brand only. It is not to be construed as an offer, solicitation, or recommendation with respect to products and services provided by the Companies operating under the FXOpen brand, nor is it to be considered financial advice.
I trade at FXOpen

User avatar
whiteking
rank: 150+ posts
rank: 150+ posts
Posts: 350
Joined: Fri Aug 11, 2017 2:25 am
Reputation: 32
Gender: None specified

Re: Daily analysis from FXOpen

Postby whiteking » Wed Jul 26, 2023 1:24 pm

Market Analysis: EUR/USD Takes Hit While USD/JPY Turns Green
Image

EUR/USD started a fresh decline below 1.1145. USD/JPY climbed higher above 141.00, but it might now correct gains in the near term.

Important Takeaways for EUR/USD and USD/JPY Analysis Today
  • The Euro declined below the 1.1145 and 1.1095 support levels.
  • There is a major bearish trend line forming with resistance near 1.1095 on the hourly chart of EUR/USD at FXOpen.
  • USD/JPY climbed higher above the 140.00 and 141.35 levels.
  • There is a key bearish trend line forming with resistance near 141.35 on the hourly chart at FXOpen.

EUR/USD Technical Analysis

On the hourly chart of EUR/USD at FXOpen, the pair started a fresh decline from the 1.1230 zone. The Euro declined below the 1.1140 support zone against the US Dollar.

Image

The pair even settled below the 1.1095 zone and the 50-hour simple moving average. A low is formed near 1.1020, and the pair is now consolidating losses near the 23.6% Fib retracement level of the recent decline from the 1.1146 swing high to the 1.1020 low.

On the upside, the pair is now facing resistance near the 50-hour simple moving average at 1.1065. The next major resistance is near a bearish trend line at 1.1095.

The 50% Fib retracement level of the recent decline from the 1.1146 swing high to the 1.1020 low is also near 1.1095. An upside break above 1.1095 could set the pace for another increase. In the stated case, the pair might rise toward 1.1140.

If not, the pair might resume its decline. The first major support is near 1.1020. The next key support is near 1.1000. If there is a downside break below 1.1000, the pair could drop toward 1.0965. The main support on the EUR/USD chart is near 1.0920, below which the pair could start a major decline.

This article represents the opinion of the Companies operating under the FXOpen brand only. It is not to be construed as an offer, solicitation, or recommendation with respect to products and services provided by the Companies operating under the FXOpen brand, nor is it to be considered financial advice.
I trade at FXOpen

Please add www.kreslik.com to your ad blocker white list.
Thank you for your support.

User avatar
whiteking
rank: 150+ posts
rank: 150+ posts
Posts: 350
Joined: Fri Aug 11, 2017 2:25 am
Reputation: 32
Gender: None specified

Re: Daily analysis from FXOpen

Postby whiteking » Thu Jul 27, 2023 11:52 am

Market Analysis: The US Dollar Weakens After the Fed's Decision to Raise Rates
Image

After the 11th increase, the interest rate reached 5.5%.

At the same time, the US dollar weakened because:
  • market participants may consider this to be the last hike in the cycle (although Powell admitted the possibility of a rate hike in September);
  • the Fed is no longer considering a recession scenario, which has reduced the relevance of cash as a defensive asset. Reuters reports analysts saying Powell's tone has become more dovish.
The weakening of the US dollar led to an increase in the prices of currencies traded in tandem with the USD. Thus, the EUR/USD rate rose by 0.75% from the low of the week, where the support block is located:
  • level 50% of growth A->B;
  • median line of the ascending channel (shown in blue);
  • level 1.02, which worked as a resistance in June.
At the same time, the nearest resistance is at the level of 1.111, which was support last week. Pay attention to the rate of decline in the price on the EUR/USD chart on the 20th and 24th — a sign of the initiative of the bears. Will they be able to break through the support block, or will the bulls intend to use it as a support for a new swing within the channel shown in blue? There should be more arguments for reasoning after the news from the ECB is released today at 15:15 GMT+3.
Image

This article represents the opinion of the Companies operating under the FXOpen brand only. It is not to be construed as an offer, solicitation, or recommendation with respect to products and services provided by the Companies operating under the FXOpen brand, nor is it to be considered financial advice.
I trade at FXOpen

User avatar
whiteking
rank: 150+ posts
rank: 150+ posts
Posts: 350
Joined: Fri Aug 11, 2017 2:25 am
Reputation: 32
Gender: None specified

Re: Daily analysis from FXOpen

Postby whiteking » Fri Jul 28, 2023 12:03 pm

Market Analysis: AUD/USD and NZD/USD Breakdown Looks Real
Image

AUD/USD declined below the 0.6760 and 0.6720 support levels. NZD/USD also declined towards 0.6150, and it remains at risk of more losses.

Important Takeaways for AUD/USD and NZD/USD Analysis Today
  • The Aussie Dollar started a fresh decline from well above the 0.6800 level against the US Dollar.
  • There was a break below a key bullish trend line with support near 0.6750 on the hourly chart of AUD/USD at FXOpen.
  • NZD/USD declined heavily from the 0.6260 resistance zone.
  • There was a break below a major bullish trend line with support near 0.6200 on the hourly chart of NZD/USD at FXOpen.

[size=`140]AUD/USD Technical Analysis[/size]

On the hourly chart of AUD/USD at FXOpen, the pair struggled to stay above the 0.6800 level. The Aussie Dollar started a fresh decline below the 0.6760 support against the US Dollar.
Image

There was a break below a key bullish trend line with support near 0.6750. The pair even settled below 0.6720 and the 50-hour simple moving average. A low is formed near 0.6655, and the pair is now consolidating losses.

Immediate resistance on the upside is near the 23.6% Fib retracement level of the downward move from the 0.6821 swing high to the 0.6655 low at 0.6695.

The next major resistance is near 0.6720, above which the price could rise toward the 50-hour simple moving average and the 61.8% Fib retracement level of the downward move from the 0.6821 swing high to the 0.6655 low.

A close above the 0.6760 level could start another steady increase in the near term. The next major resistance on the AUD/USD chart could be 0.6790.

On the downside, initial support is near the 0.6655 level. The next support could be the 0.6620 level. If there is a downside break below 0.6620, the pair could extend its decline toward the 0.6600 handle. Any more losses might send the pair toward the 0.6550 support.

This article represents the opinion of the Companies operating under the FXOpen brand only. It is not to be construed as an offer, solicitation, or recommendation with respect to products and services provided by the Companies operating under the FXOpen brand, nor is it to be considered financial advice.
I trade at FXOpen

User avatar
whiteking
rank: 150+ posts
rank: 150+ posts
Posts: 350
Joined: Fri Aug 11, 2017 2:25 am
Reputation: 32
Gender: None specified

Re: Daily analysis from FXOpen

Postby whiteking » Mon Jul 31, 2023 12:54 pm

Market Analysis: GBP/USD Attempts Fresh Increase While EUR/GBP Faces Hurdle
Image

GBP/USD is attempting a fresh increase from the 1.2770 region. EUR/GBP is consolidating and remains at risk of more downsides below 0.8545.


Important Takeaways for GBP/USD and EUR/GBP Analysis Today
  • The British Pound started a steady increase above the 1.2805 resistance.
  • There is a short-term contracting triangle forming with resistance near 1.2860 on the hourly chart of GBP/USD at FXOpen.
  • EUR/GBP declined below the 0.8600 and 0.8580 support levels.
  • There is a key breakout pattern forming with support near 0.8560 on the hourly chart at FXOpen.

GBP/USD Technical Analysis

On the hourly chart of GBP/USD at FXOpen, the pair started a fresh decline from the 1.3000 zone. As mentioned in the previous analysis, the British Pound would remain at risk of more downsides if it cleared the 1.2840 and 1.2805 levels against the US Dollar.
Image

The pair extended its decline and tested the 1.2770 zone. A low is formed near 1.2762, and the pair is now attempting a fresh increase. There was a move above the 23.6% Fib retracement level of the downward move from the 1.2995 swing high to the 1.2762 low.

The pair is now consolidating below the 50-hour simple moving average. The GBP/USD chart indicates that the pair is facing resistance near a short-term contracting triangle at 1.2860.

The next major resistance is near the 50% Fib retracement level of the downward move from the 1.2995 swing high to the 1.2762 low at 1.2880. The main breakout zone could be 1.2900. If the RSI moves above 60 and the pair climbs above 1.2900, there could be another rally. In the stated case, the pair could rise toward the 1.3000 level or even 1.3050.

On the downside, there is a major support forming near 1.2805. If there is a downside break below it, the pair could accelerate lower.

The next major support is near the 1.2770 zone, below which GBP/USD could test 1.2740. Any more losses could lead the pair toward 1.2650.

This article represents the opinion of the Companies operating under the FXOpen brand only. It is not to be construed as an offer, solicitation, or recommendation with respect to products and services provided by the Companies operating under the FXOpen brand, nor is it to be considered financial advice.
I trade at FXOpen

User avatar
whiteking
rank: 150+ posts
rank: 150+ posts
Posts: 350
Joined: Fri Aug 11, 2017 2:25 am
Reputation: 32
Gender: None specified

Re: Daily analysis from FXOpen

Postby whiteking » Tue Aug 01, 2023 1:46 pm

Market Analysis: Australian Dollar Plummeting After RBA Decision
Image

The Reserve Bank of Australia (RBA) this morning decided to leave the interest rate at 4.10%, although market participants expected an increase to 4.35%.

According to the forecast of the central bank, inflation in Australia will return to its target range of 2-3% by the end of 2025 from the current 6%. At the same time, a warning was made that additional tightening (rate increase) may be required to curb inflation.
Image

Amid the RBA's decision, the Australian dollar weakened against other currencies. So, on the AUD/USD chart, the price fell below the level of 0.665. At the same time, a reversal was formed from the median line of the channel, shown in blue; at yesterday's maximum, it was tested as a resistance line.

If the downward movement on the AUD/USD pair caused by the RBA decision continues, then the market may find support:
  • at the level of 0.6624 – where important July lows were formed;
  • at the level of 0.66 – there are important June lows;
  • near the lower border of the blue channel.

This article represents the opinion of the Companies operating under the FXOpen brand only. It is not to be construed as an offer, solicitation, or recommendation with respect to products and services provided by the Companies operating under the FXOpen brand, nor is it to be considered financial advice.
I trade at FXOpen

User avatar
whiteking
rank: 150+ posts
rank: 150+ posts
Posts: 350
Joined: Fri Aug 11, 2017 2:25 am
Reputation: 32
Gender: None specified

Re: Daily analysis from FXOpen

Postby whiteking » Wed Aug 02, 2023 12:34 pm

EUR/USD and USD/JPY Daily Chart Outlook: Dollar Could Outperform
Image

EUR/USD started a fresh decline from the 1.1265 zone. USD/JPY is rising and might aim to move above the 144.85 resistance.

Important Takeaways for EUR/USD and USD/JPY Analysis
  • The Euro failed to clear 1.1265 and declined below 1.1090.
  • There is a key bullish trend line forming with support near 1.0965 on the daily chart of EUR/USD at FXOpen.
  • USD/JPY climbed above the 140.00 and 141.15 levels.
  • There is a major bullish trend line in place with support at 139.00 on the daily chart at FXOpen.
EUR/USD Technical Analysis

On the daily chart of EUR/USD at FXOpen, the pair started a fresh decline from the 1.1265 zone. The Euro declined below the 1.1090 support zone to move into a short-term bearish zone against the US Dollar.
Image

The pair even spiked below 1.1000 before the bulls emerged near 1.0965. The euro seems to be finding bids near the 50% Fib retracement level of the upward move from the 1.0661 swing low to the 1.1275 high.

There is also a key bullish trend line forming with support near 1.0965. The main support on the EUR/USD chart is near the 50-day simple moving average at 1.0920.

The 61.8% Fib retracement level of the upward move from the 1.0661 swing low to the 1.1275 high is also near 1.0920. If there is a downside break below 1.0920, the pair could drop toward 1.0800. Any more losses could open the doors for a move to 1.0660.

On the upside, the pair is facing resistance near the 1.1090 zone, above which the bulls might aim for a steady increase. The next major resistance is near 1.1265. An upside break above 1.1265 could set the pace for another increase. In the stated case, the pair might rise toward 1.1340.

This article represents the opinion of the Companies operating under the FXOpen brand only. It is not to be construed as an offer, solicitation, or recommendation with respect to products and services provided by the Companies operating under the FXOpen brand, nor is it to be considered financial advice.
I trade at FXOpen

Please add www.kreslik.com to your ad blocker white list.
Thank you for your support.


Return to “forex”