Daily analysis from FXOpen

forex live trades, setups, charts

Moderator: moderators

User avatar
whiteking
rank: 150+ posts
rank: 150+ posts
Posts: 350
Joined: Fri Aug 11, 2017 2:25 am
Reputation: 32
Gender: None specified

Re: Daily analysis from FXOpen

Postby whiteking » Thu Aug 03, 2023 1:37 pm

Market Analysis: The GBP/USD Exchange Rate Falls to a Month’s Minimum
Image

Yesterday and today, the GBP/USD rate fell below 1.27 for the first time since July 6. A number of factors contributed to this:
  • rising bond yields amid downgrade of the US rating by Fitch;
  • strong data on the ADP labor market — the number of jobs in the US, excluding the agricultural sector, increased by more than 300k over the month;
  • market expectation of news from the Bank of England, which will publish its interest rate decision today at 14:00 GMT+3.
According to Reuters, forecasts for the UK economy are disappointing. Market participants expect a 14th rate hike by the Bank of England by 0.25%.

Image

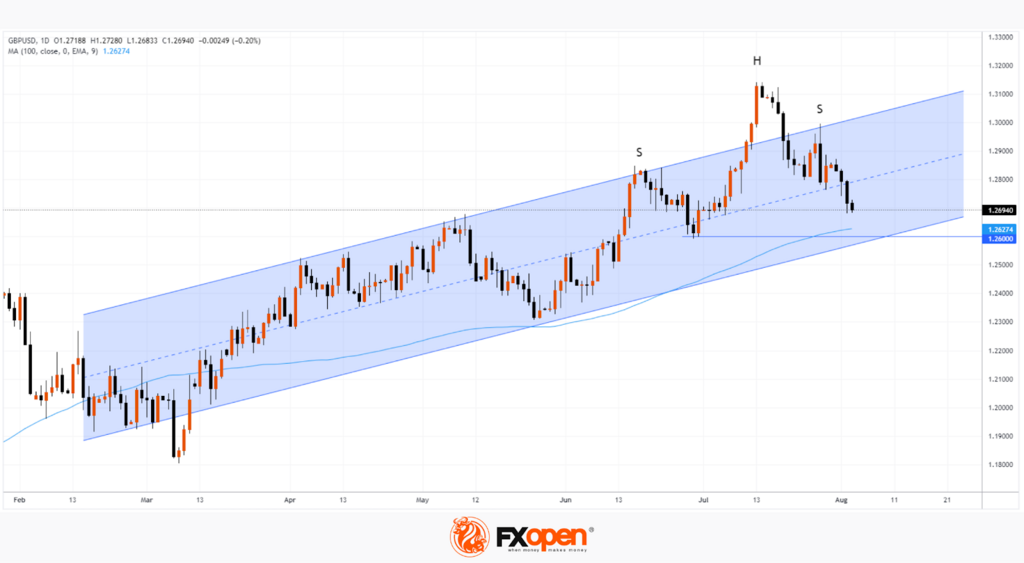
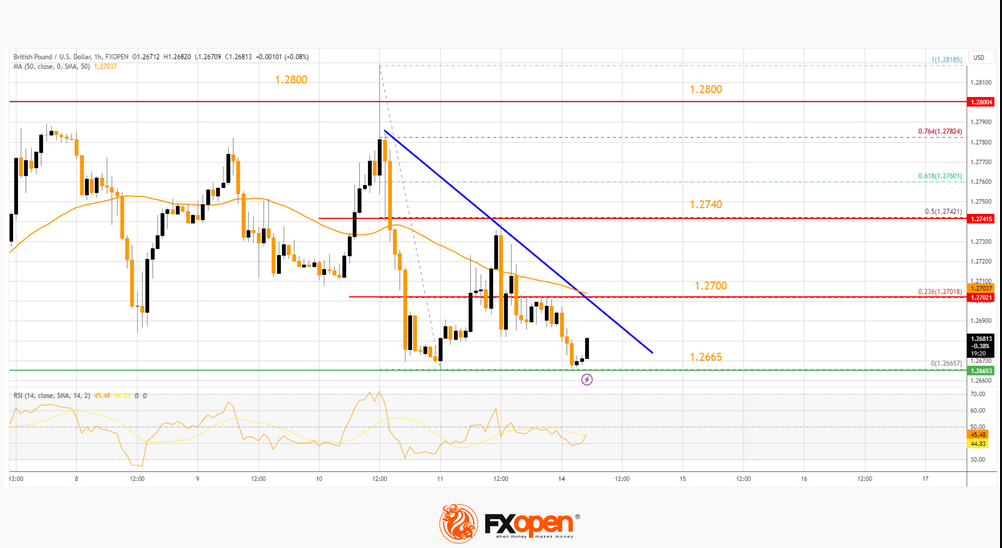
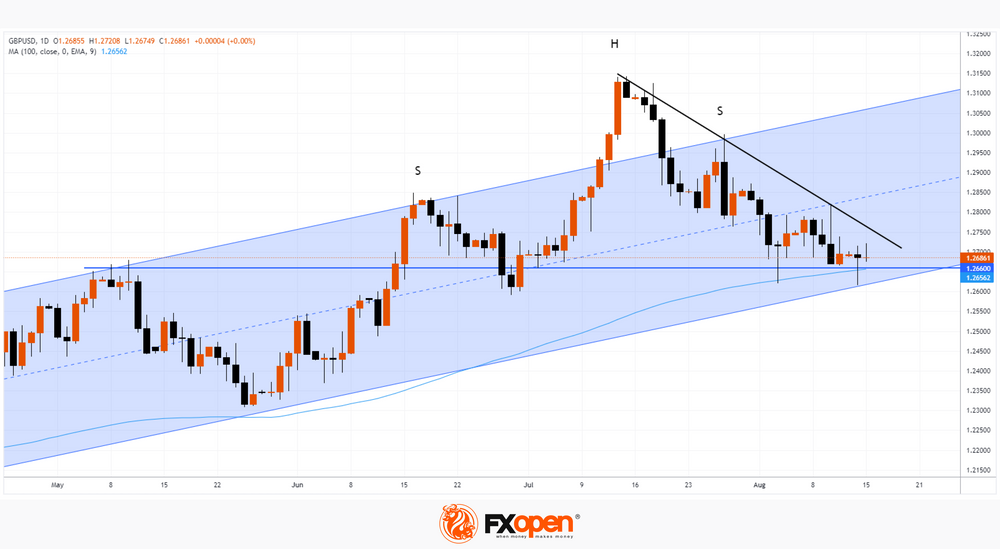
Technical analysis of the GBP/USD chart shows that:
  • summer peaks formed an important head-and-shoulders pattern;
  • the neckline, which can be drawn through the median line of the ascending channel, has already been broken after a weak rebound in the last days of July.

The pound, which looks weak against the US dollar, may be supported by:
  • encouraging words from the head of the Bank of England;
  • block of support formed in the area of 1.2600 from the low of June, the lower border of the channel and SMA (100).
Get ready for bursts of volatility in the GBP/USD market.


This article represents the opinion of the Companies operating under the FXOpen brand only. It is not to be construed as an offer, solicitation, or recommendation with respect to products and services provided by the Companies operating under the FXOpen brand, nor is it to be considered financial advice.
I trade at FXOpen

Please add www.kreslik.com to your ad blocker white list.
Thank you for your support.

User avatar
whiteking
rank: 150+ posts
rank: 150+ posts
Posts: 350
Joined: Fri Aug 11, 2017 2:25 am
Reputation: 32
Gender: None specified

Re: Daily analysis from FXOpen

Postby whiteking » Fri Aug 04, 2023 12:28 pm

Gold and Crude Oil: Long-Term Outlook
Image

Gold price could restart a steady increase above the $1,990 resistance. Crude oil price is rising and it could climb further higher toward $85.

Important Takeaways for Gold and Oil Prices Analysis Today
  • Gold price corrected lower from $2,080 and tested $1,900 against the US Dollar.
  • A key bullish trend line is forming with support at $1,940 on the daily chart of gold at FXOpen.
  • Crude oil prices are moving higher above the $76.75 resistance zone.
  • There was a break above a key contracting triangle with resistance near $71.00 on the daily chart of XTI/USD at FXOpen.
Gold Price Technical Analysis

On the daily chart of Gold at FXOpen, the price started a downside correction from the $2,080 zone. The price traded below the $2,050 and $1,990 levels.

Image

Finally, the bulls appeared near the $1,900 level. A low was formed near $1,900 and the price is now attempting a fresh increase. There was a move above the 23.6% Fib retracement level of the downward move from the $2,080 swing high to the $1,900 low.

The price is now trading above the 50-day simple moving average. There is also a key bullish trend line forming with support at $1,940.

Immediate resistance is near the 50% Fib retracement level of the downward move from the $2,080 swing high to the $1,900 low at $1,990. The next major resistance is near $2,000. An upside break above $2,000 could send Gold price toward $2,050. Any more gains may perhaps set the pace for an increase toward the $2,080 level.

Initial support on the downside is near the $1,940 level. The first major support is near $1,900. If there is a downside break below $1,900, the price might decline further. In the stated case, XAU/USD might drop toward $1,805.


This article represents the opinion of the Companies operating under the FXOpen brand only. It is not to be construed as an offer, solicitation, or recommendation with respect to products and services provided by the Companies operating under the FXOpen brand, nor is it to be considered financial advice.
I trade at FXOpen

User avatar
whiteking
rank: 150+ posts
rank: 150+ posts
Posts: 350
Joined: Fri Aug 11, 2017 2:25 am
Reputation: 32
Gender: None specified

Re: Daily analysis from FXOpen

Postby whiteking » Mon Aug 07, 2023 1:20 pm

GBP/USD Struggles
Image

GBP/USD is struggling to gain pace above the 1.2800 resistance.

Important Takeaways for GBP/USD Analysis Today
  • The British Pound is attempting a fresh increase above 1.2680.
  • There was a break above a key bearish trend line with resistance near 1.2725 on the hourly chart of GBP/USD at FXOpen.

[size=`140]GBP/USD Technical Analysis[/size]

On the hourly chart of GBP/USD at FXOpen, the pair started a fresh decline from the 1.2880 zone. As mentioned in the previous analysis, the British Pound extended losses below the 1.2800 pivot level against the US Dollar.

The pair even tested the 1.2620 support zone. A low was formed near 1.2620 and the pair is now attempting a fresh increase. There was a move above the 1.2680 resistance zone. Besides, there was a break above a key bearish trend line with resistance near 1.2725.

Image

However, the pair struggled to clear the 1.2800 resistance zone. A high is formed near 1.2792 and the pair is now correcting gains. It is trading near the 50-hour simple moving average at 1.2725 and approaching the 50% Fib retracement level of the upward move from the 1.2620 swing low to the 1.2792 high.

On the downside, there is a key support forming near 1.2680. It is close to the 61.8% Fib retracement level of the upward move from the 1.2620 swing low to the 1.2792 high.

If there is a downside break below the 1.2680 support, the pair could accelerate lower. The next major support is near the 1.2620 zone, below which the pair could test 1.2550. Any more losses could lead the pair toward the 1.2500 support.

On the upside, the GBP/USD chart indicates that the pair is facing resistance near 1.2750. The next major resistance is near the 1.2800 zone. A close above the 1.2800 resistance zone could open the doors for a move toward 1.2880.

This article represents the opinion of the Companies operating under the FXOpen brand only. It is not to be construed as an offer, solicitation, or recommendation with respect to products and services provided by the Companies operating under the FXOpen brand, nor is it to be considered financial advice.
I trade at FXOpen

User avatar
whiteking
rank: 150+ posts
rank: 150+ posts
Posts: 350
Joined: Fri Aug 11, 2017 2:25 am
Reputation: 32
Gender: None specified

Re: Daily analysis from FXOpen

Postby whiteking » Tue Aug 08, 2023 1:33 pm

BTC/USD Price Analysis: ADX Indicator Falls to the Lowest Level of 2023
Image

The latest news from the world of cryptocurrencies could be both bearish and bullish drivers:

-> PayPal launches a stablecoin that will be pegged to the dollar and backed by US Treasuries;

-> Cathie Wood believes that the SEC can approve several BTC ETFs at the same time;

-> the Central Bank of Brazil plans to launch its digital currency called DREX in 2024;

-> rumors about problems with the USDC stablecoin are spreading in the network;

-> the US Department of Justice is considering filing fraud charges against Binance.

However, the BTC/USD rate has stabilized around USD 29,000 per coin since July 25th. The bitcoin market is showing unusually low volatility (except for the surge associated with news from the Fed). At the same time, the ADX indicator, which helps determine the presence of a trend, fell to its lowest level since 2023. Obviously, this indicates that the market is flat. But note the trend that followed in early 2023 as the ADX fell close to its current low.
Image

At the beginning of August, the BTC/USD rate was limited by the resistance level of 29,900 and the support level of 28,800. A breakdown of one of these levels can lead to the beginning of a strong trend against the backdrop of a low ADX value — this has happened more than once historically.


This article represents the opinion of the Companies operating under the FXOpen brand only. It is not to be construed as an offer, solicitation, or recommendation with respect to products and services provided by the Companies operating under the FXOpen brand, nor is it to be considered financial advice.
I trade at FXOpen

User avatar
whiteking
rank: 150+ posts
rank: 150+ posts
Posts: 350
Joined: Fri Aug 11, 2017 2:25 am
Reputation: 32
Gender: None specified

Re: Daily analysis from FXOpen

Postby whiteking » Wed Aug 09, 2023 2:09 pm

Market Analysis: EUR/USD Dips Again While USD/JPY Gains Traction
Image

EUR/USD started a fresh decline from 1.1040. USD/JPY is rising and might climb further toward the 145.00 resistance zone.

Important Takeaways for EUR/USD and USD/JPY Analysis Today
  • The Euro started a fresh decline from the 1.1040 resistance zone.
  • There is a key bearish trend line forming with resistance near 1.0975 on the hourly chart of EUR/USD at FXOpen.
  • USD/JPY climbed higher above the 142.50 and 143.00 levels.
  • There is a major bullish trend line forming with support near 143.00 on the hourly chart at FXOpen.

EUR/USD Technical Analysis

On the hourly chart of EUR/USD at FXOpen, the pair started a fresh decline from the 1.1040 zone. The Euro declined below the 1.1015 support zone against the US Dollar.

The pair even settled below the 1.1000 zone and the 50-hour simple moving average. A low is formed near 1.0929 and the pair is now correcting losses above the 23.6% Fib retracement level of the recent decline from the 1.1042 swing high to the 1.0929 low.
Image

On the upside, the pair is now facing resistance near the 50-hour simple moving average at 1.0975 and a key bearish trend line. The next major resistance is near 1.1015.

The 76.4% Fib retracement level of the recent decline from the 1.1042 swing high to the 1.0929 low is also near 1.1015. The main resistance is still near 1.1040. An upside break above 1.1040 could set the pace for another increase. In the stated case, the pair might rise toward 1.1100.

If not, the pair might resume its decline. The first major support on the EUR/USD chart is near 1.0930. The next key support is near 1.0910. If there is a downside break below 1.0910, the pair could drop toward 1.0880. The main support is near 1.0850, below which the pair could start a major decline.

This article represents the opinion of the Companies operating under the FXOpen brand only. It is not to be construed as an offer, solicitation, or recommendation with respect to products and services provided by the Companies operating under the FXOpen brand, nor is it to be considered financial advice.
I trade at FXOpen

Please add www.kreslik.com to your ad blocker white list.
Thank you for your support.

User avatar
whiteking
rank: 150+ posts
rank: 150+ posts
Posts: 350
Joined: Fri Aug 11, 2017 2:25 am
Reputation: 32
Gender: None specified

Re: Daily analysis from FXOpen

Postby whiteking » Thu Aug 10, 2023 3:06 pm

EURJPY Analysis: Highest Since Fall 2008
Image

Yen Weakening Drivers:
-> rising prices for energy resources. After all, Japan is a major importer.
-> The inflation index CGPI (corporate goods price index) indicates a slowdown in inflation. Therefore, this raises the likelihood that the Bank of Japan will maintain an ultra-loose monetary policy.

The growth of the euro against the yen is facilitated by the fact that the ECB is pursuing a tough policy. Market participants expect that another rate increase could be made in autumn.

The EUR/JPY chart shows that the rate is in an uptrend. The market recovered quickly from the sharp decline on July 27, a testament to the strength of demand. Another piece of evidence is the amount of B->C retracement after A->B rises. It was only about 30% of the momentum.
Image

Support levels:
-> 157.85. After the breakout by the bulls, the previous resistance may provide support, as was the case with the 151.55 level, which worked as a resistance in May, but provided support at the end of June;
-> median channel line.

Resistance Levels:
-> upper border of the channel;
-> the psychological level of 160 yen per euro.

Today (at 15:30 GMT+3) inflation news in the US is expected, which can shake financial markets a lot.


This article represents the opinion of the Companies operating under the FXOpen brand only. It is not to be construed as an offer, solicitation, or recommendation with respect to products and services provided by the Companies operating under the FXOpen brand, nor is it to be considered financial advice.
I trade at FXOpen

User avatar
whiteking
rank: 150+ posts
rank: 150+ posts
Posts: 350
Joined: Fri Aug 11, 2017 2:25 am
Reputation: 32
Gender: None specified

Re: Daily analysis from FXOpen

Postby whiteking » Fri Aug 11, 2023 3:04 pm

XAU/USD Price Analysis: Bears Approach Important Support
Image

Yesterday, fresh values of the CPI index were published, which testified to a moderate slowdown in inflation in the US. The actual value was 3.2% in annual terms (expected 3.3%, a month earlier = 3.0%, a year earlier = 9.1%).

In reaction to the news, the price of gold fell from a daily high around USD 1,930 an ounce to renew the August low. Such behavior can be interpreted as a decrease in the value of the precious metal, as it loses its relevance as a protective asset against inflation.

Earlier we wrote that August began for the gold market in a bearish way. The trend continues.

Technical analysis of the XAU/USD chart on the 4-hour timeframe shows that:
-> the price develops dynamics within the descending channel, which has been operating since May of this year;
-> yesterday there was a test of resistance at the level of USD 1,930, which served as support in early August. This is a bearish sign;
-> the price of gold is approaching an important support at the psychological level of USD 1,900 per ounce;
-> a series of lower highs is formed on the chart;
-> the RSI indicator rose from the oversold zone, forming a bullish divergence pattern.
Image

It is reasonable to assume that when approaching psychological support, the bears in the gold market will lose confidence, and therefore rebounds are possible. But in order for them to develop into a sustainable rally, it will probably take the impact of important news.


This article represents the opinion of the Companies operating under the FXOpen brand only. It is not to be construed as an offer, solicitation, or recommendation with respect to products and services provided by the Companies operating under the FXOpen brand, nor is it to be considered financial advice.
I trade at FXOpen

User avatar
whiteking
rank: 150+ posts
rank: 150+ posts
Posts: 350
Joined: Fri Aug 11, 2017 2:25 am
Reputation: 32
Gender: None specified

Re: Daily analysis from FXOpen

Postby whiteking » Mon Aug 14, 2023 12:22 pm

Market Analysis: GBP/USD Turns Red While USD/CAD Climbs Higher
Image

GBP/USD is showing bearish signs below 1.2700. USD/CAD is rising and might gain pace above the 1.3500 resistance zone.


Important Takeaways for GBP/USD and USD/CAD Analysis Today
  • The British Pound started a fresh decline from the 1.2800 resistance zone.
  • There is a key bearish trend line forming with resistance near 1.2700 on the hourly chart of GBP/USD at FXOpen.
  • USD/CAD is rising steadily from the 1.3400 support zone.
  • There is a major bullish trend line forming with support near 1.3450 on the hourly chart at FXOpen.
GBP/USD Technical Analysis

On the hourly chart of GBP/USD at FXOpen, the pair started a fresh decline from the 1.2800 zone. The British Pound traded below the 1.2740 support to move into a bearish zone against the US Dollar.

The pair even traded below 1.2700 and the 50-hour simple moving average. Finally, the bulls appeared near the 1.2665 level. A low is formed near 1.2665 and the pair is now consolidating losses. There is also a key bearish trend line forming with resistance near 1.2700.
Image

The trend line is near the 23.6% Fib retracement level of the downward move from the 1.2818 swing high to the 1.2665 low. The first major resistance on the GBP/USD chart is near 1.2740.

The 50% Fib retracement level of the downward move from the 1.2818 swing high to the 1.2665 low is also near 1.2740. The next major resistance is near the 1.2800 level. Any more gains could lead the pair toward the 1.2880 resistance in the near term.

Initial support sits near 1.2665. The next major support sits at 1.2650 or 1.2640, below which there is a risk of a sharp decline. In the stated case, the pair could drop toward 1.2550.


This article represents the opinion of the Companies operating under the FXOpen brand only. It is not to be construed as an offer, solicitation, or recommendation with respect to products and services provided by the Companies operating under the FXOpen brand, nor is it to be considered financial advice.
I trade at FXOpen

User avatar
whiteking
rank: 150+ posts
rank: 150+ posts
Posts: 350
Joined: Fri Aug 11, 2017 2:25 am
Reputation: 32
Gender: None specified

Re: Daily analysis from FXOpen

Postby whiteking » Tue Aug 15, 2023 1:43 pm

GBP/USD Analysis: The Pound Trying to Grow on News from Labor Market
Image

On Tuesday morning data from the UK market were published:

-> base wage rose at a record pace in the second quarter. It was 7.8% higher than a year earlier, representing the highest annual growth rate since 2001.

-> at the same time, the number of unemployed also increased. In July, 29k applications for unemployment benefits were submitted (expected - 19.2).

The first reaction of the pound is growth. It is possible that market participants have increased fears that wage growth will give the Bank of England more grounds for a sharper increase in interest rates. At the same time, the bullish momentum faded quickly, in line with the bearish momentum that has dominated the GBP/USD market since mid-July (as shown by the black line) amid the formation of the SHS pattern.

However, the situation may change.

Image

As the daily chart shows, the GBP/USD rate dropped to the border of the ascending channel, which is valid in 2023, and seems to have found support there — as a candle with a long lower shadow was formed yesterday. Buyers quickly snapped up the fall, showing strength of demand around the 1.266 support line, which is also being strengthened by the 100-day moving average.

The probability of a rate hike in September by the Bank of England by 0.25 points is 99%, according to Reuters. And the closer the decision is, the stronger the demand can become, which can lead to a bullish reversal from the block of supports and a breakdown of the black line.


This article represents the opinion of the Companies operating under the FXOpen brand only. It is not to be construed as an offer, solicitation, or recommendation with respect to products and services provided by the Companies operating under the FXOpen brand, nor is it to be considered financial advice.
I trade at FXOpen

User avatar
whiteking
rank: 150+ posts
rank: 150+ posts
Posts: 350
Joined: Fri Aug 11, 2017 2:25 am
Reputation: 32
Gender: None specified

Re: Daily analysis from FXOpen

Postby whiteking » Wed Aug 16, 2023 11:56 am

USD/CAD Analysis: The Loonie Strengthens amid Rising Inflation
Image

Yesterday, data from Statistics Canada was published, which testified to the stability of inflation in the country: the rise in prices for the month amounted to +0.6% (+0.3% was expected).

This increased the likelihood that the Bank of Canada will raise the rate yet again. Now it is at a maximum for 22 years and is 5.0%.

As a result, USD/CAD is declining today after a volatile Tuesday.

Bullish arguments:
-> the price may be supported by the median line and the lower limit of the current ascending channel;
-> the price may be supported by the level of 1.34, which previously served as resistance;
-> support may continue to be provided by the level of 1.344.

Bearish arguments:
-> the price made a false breakout of the top on August 8;
-> resistance is provided by the psychological level at 1.35;
-> divergence on the RSI indicator;
-> the price is in the zone of a sharp fall in the rate recorded on June 1 — sellers can maintain control.
Image

Since August 1, the USD/CAD rate has risen by more than 2.3%. In such conditions, a correction may be a fairly natural scenario.

This article represents the opinion of the Companies operating under the FXOpen brand only. It is not to be construed as an offer, solicitation, or recommendation with respect to products and services provided by the Companies operating under the FXOpen brand, nor is it to be considered financial advice.
I trade at FXOpen

Please add www.kreslik.com to your ad blocker white list.
Thank you for your support.


Return to “forex”