A fresh start! Doji's Trading Journal
Moderator: moderators
Please add www.kreslik.com to your ad blocker white list.
Thank you for your support.
Thank you for your support.
-
Jalarupa

- rank: 1000+ posts

- Posts: 1300
- Joined: Tue Feb 23, 2010 5:50 pm
- Reputation: 324
- Location: South Africa
- Gender:

JESGPY wrote:This may be a stupid question.
What is RB?
Been trying to figure it out
Thanks
To my understanding an RB is a Rock Box and it shows the Zline on both the high and low range in the box...
Just wait till price is in the box and trade away from the box...
hmmm....
https://www.tradingview.com/x/WzvTBr52/
This example is a poor one... but sometimes I think of it as, if a dragon line were to see and take a liking to a zero line, then they go out on a couple of dates to get to know one another. She then decides that she is getting too old for dating life and wants to settle down and maybe move in and see if she can put up with his farting and the mess he leaves after showering in the morning, because she thinks she can train him in some way... and anyway to cut a long story short, after a few years of living together they have a child, well that child would look a lot like an RB...

-
newscalper

- rank: 1000+ posts
- Posts: 1068
- Joined: Tue Oct 19, 2010 5:58 pm
- Reputation: 7
- Gender:

That's mainly right Jal - the top rhs one's not quite right as the box starts at first point of breakout on the Dragon line/colour change. The two below are 'right' though.
Last edited by newscalper on Wed Feb 12, 2014 4:12 pm, edited 1 time in total.


Does anyone understand the concept of Close Above Close Below and can clarify it for me.
I think my conceptual model what i think it is, is wrong and it keeps flip flopping with in my mind.
Thanks
BB
I think my conceptual model what i think it is, is wrong and it keeps flip flopping with in my mind.
Thanks
BB
There are two forces acting upon us: Suffering pushes us forward from behind and pleasures entice us and pull us forward.
-
Jalarupa
- rank: 1000+ posts
- Posts: 1300
- Joined: Tue Feb 23, 2010 5:50 pm
- Reputation: 324
- Location: South Africa
- Gender:
bettlebox wrote:Does anyone understand the concept of Close Above Close Below and can clarify it for me.
I think my conceptual model what i think it is, is wrong and it keeps flip flopping with in my mind.
Thanks
BB
Hey BB,
Please excuse my lack of depth and models and real awesome work like the stuff you release, but I try and understand this concept in its simplest form...
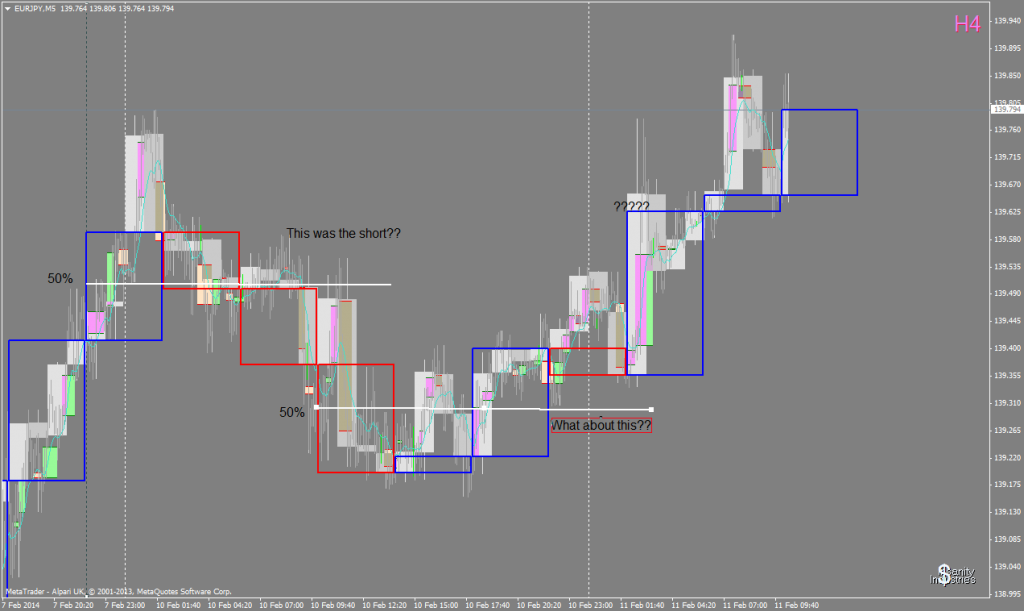
Above you will see a bunch of lines places at strategic places where there has been Open/Close momo or extreme price exhaustion or near corresponding chart patterns like the FAT CAT / Quasi Modo / Inverse H/S pattern and what you are essentially looking for is a move away from your line...
The theory is that price may CROSS the line, BUT may not close beyond the line... Otherwise you made a mistake in your assimilation of what is a good line...
A good line is something that is in a Demand or Supply Zone (something you know very much about)
Personally I like to draw them at Dragon Lines Open/Close areas after a strong turn in price. BUT I have seem MO look towards a extreme that sits in a ZONE of imbalance and that extreme although not coming off as strong an area as a Dragon Line does supply a lot of info regarding PA at that price level...
So yeah, also its not a perfect science but a simple one... try not to over complicate it and you'll see great benefits in its application.
I hope I have helped you in some small way
Please add www.kreslik.com to your ad blocker white list.
Thank you for your support.
Thank you for your support.
Hi Jara
Thanks.
Ok Maybe this why its flip flopping in my mind. Looks like I mis-read something along way or pickup on something that isnt there.
This is concept i had in my mind for "Close above, Close below". Its not even close. I will have to be careful what i allow into my conceptual mind.
I dont even know what this is.
Jalarupa wrote:bettlebox wrote:Does anyone understand the concept of Close Above Close Below and can clarify it for me.
I think my conceptual model what i think it is, is wrong and it keeps flip flopping with in my mind.
Thanks
BB
Hey BB,
Please excuse my lack of depth and models and real awesome work like the stuff you release, but I try and understand this concept in its simplest form...
Above you will see a bunch of lines places at strategic places where there has been Open/Close momo or extreme price exhaustion or near corresponding chart patterns like the FAT CAT / Quasi Modo / Inverse H/S pattern and what you are essentially looking for is a move away from your line...
The theory is that price may CROSS the line, BUT may not close beyond the line... Otherwise you made a mistake in your assimilation of what is a good line...
A good line is something that is in a Demand or Supply Zone (something you know very much about)
Personally I like to draw them at Dragon Lines Open/Close areas after a strong turn in price. BUT I have seem MO look towards a extreme that sits in a ZONE of imbalance and that extreme although not coming off as strong an area as a Dragon Line does supply a lot of info regarding PA at that price level...
So yeah, also its not a perfect science but a simple one... try not to over complicate it and you'll see great benefits in its application.
I hope I have helped you in some small way
There are two forces acting upon us: Suffering pushes us forward from behind and pleasures entice us and pull us forward.
-
Jalarupa
- rank: 1000+ posts
- Posts: 1300
- Joined: Tue Feb 23, 2010 5:50 pm
- Reputation: 324
- Location: South Africa
- Gender:
bettlebox wrote:Hi Jara
Thanks.
Ok Maybe this why its flip flopping in my mind. Looks like I mis-read something along way or pickup on something that isnt there.
This is concept i had in my mind for "Close above, Close below". Its not even close. I will have to be careful what i allow into my conceptual mind.
I dont even know what this is.Jalarupa wrote:bettlebox wrote:Does anyone understand the concept of Close Above Close Below and can clarify it for me.
I think my conceptual model what i think it is, is wrong and it keeps flip flopping with in my mind.
Thanks
BB
Hey BB,
Please excuse my lack of depth and models and real awesome work like the stuff you release, but I try and understand this concept in its simplest form...
Above you will see a bunch of lines places at strategic places where there has been Open/Close momo or extreme price exhaustion or near corresponding chart patterns like the FAT CAT / Quasi Modo / Inverse H/S pattern and what you are essentially looking for is a move away from your line...
The theory is that price may CROSS the line, BUT may not close beyond the line... Otherwise you made a mistake in your assimilation of what is a good line...
A good line is something that is in a Demand or Supply Zone (something you know very much about)
Personally I like to draw them at Dragon Lines Open/Close areas after a strong turn in price. BUT I have seem MO look towards a extreme that sits in a ZONE of imbalance and that extreme although not coming off as strong an area as a Dragon Line does supply a lot of info regarding PA at that price level...
So yeah, also its not a perfect science but a simple one... try not to over complicate it and you'll see great benefits in its application.
I hope I have helped you in some small way
Just note if you looking at it in this way, that you can combine candles to get the effect you are suggesting... or you can focus on the higher time frame candle and what it is telling you of the same line
-
dojirock

- rank: 1000+ posts
- Posts: 1922
- Joined: Tue Nov 17, 2009 10:11 pm
- Reputation: 729
- Gender:
- Contact:
Im sorry guys, those of you that are still struggling or have been for a while. Dont be afraid to look different ways. DC is very successful with his method. RB's work wonderfully for me.
I drew up Jala's chart with Rb's to show how easy it is to interpet momentum. I use 2 time frames.
The open of the RB boxes is the originating point of momentum. Same as a color change that dragon uses. Zline, Zline...ugh...is anywhere in that zone.
It takes momentum to break momentum. These are all the rb areas...they are not drawn discretionary. They can be read in a couple differnent ways but it really is simple.
I then marked up 3 more charts with RB's and added the macd that DC uses and all the "hopper traders use" RB's filter out bad trades! DC uses on renko or range bars. I find RB's are more accurate on time charts overall. But just taking DC's method...cross of the macd zero line and then a 123 setup...look at those areas...what happens to the rb's in those areas? What happens to the RB's on the false breaks of the macd zero cross?
Hope this helps...
Make some pips!
- Attachments
-
- eurjpyh1bbbbb.png (77.92 KiB) Viewed 3947 times
-
- eurjpyh1bbbb.png (81.59 KiB) Viewed 3947 times
-
- eurjpyh1bbb.png (77.7 KiB) Viewed 3947 times
-
- audcad-d1-armada-markets.png (28.32 KiB) Viewed 3947 times
It always takes Momentum to break Momentum!
"A small loss is just as satisfying as a large gain" -MO
"Sometimes we need to stop learning and start thinking...."
"Once you stack, you'll never go back!"
"A small loss is just as satisfying as a large gain" -MO
"Sometimes we need to stop learning and start thinking...."
"Once you stack, you'll never go back!"
-
dojirock
- rank: 1000+ posts
- Posts: 1922
- Joined: Tue Nov 17, 2009 10:11 pm
- Reputation: 729
- Gender:
- Contact:
Also, my comment about stacking. News, I take the break of the RB. That becomes my open line. I expect a retrace back then as it comes back to my open line and moves in my direction I stack the crap out of it. This way when I am wrong im only out my original lot size. When im right its amped up! If I get a new RB and sitll in the trade then I move my open line to the close of the new RB, wait for a retrace and then stack more as it comes back and crosses that line again. Price more times than not, because the Rb's signify momentum, it never returns to that area again for that trade.
doji

ps... wus up DC! Hope all is well with you.
doji
ps... wus up DC! Hope all is well with you.
It always takes Momentum to break Momentum!
"A small loss is just as satisfying as a large gain" -MO
"Sometimes we need to stop learning and start thinking...."
"Once you stack, you'll never go back!"
"A small loss is just as satisfying as a large gain" -MO
"Sometimes we need to stop learning and start thinking...."
"Once you stack, you'll never go back!"


Exits...
Still struggling at exiting where I should...
Do you guys have any comments?
(entry was late but ok, should have enter at 0.8972)
Do you guys have any comments?
(entry was late but ok, should have enter at 0.8972)
- Attachments
-
- poorexit_a.GIF (46.73 KiB) Viewed 3788 times
-
- poorexit_b.GIF (93.59 KiB) Viewed 3788 times
Please add www.kreslik.com to your ad blocker white list.
Thank you for your support.
Thank you for your support.