Ok, TRO - when you get back from the South, I've got more.
TCD Extrapolations
Let's make sense out of the whole TCD thing-a-ma-bob. There are actually three (3) of them:
Strategic TCD (MovingAverage)
Tactical TCD (AbsoluteValue)
Real-Time TCD (NextBarProjection)
Let's draw a picture, as this may help to visualize how it was first designed:
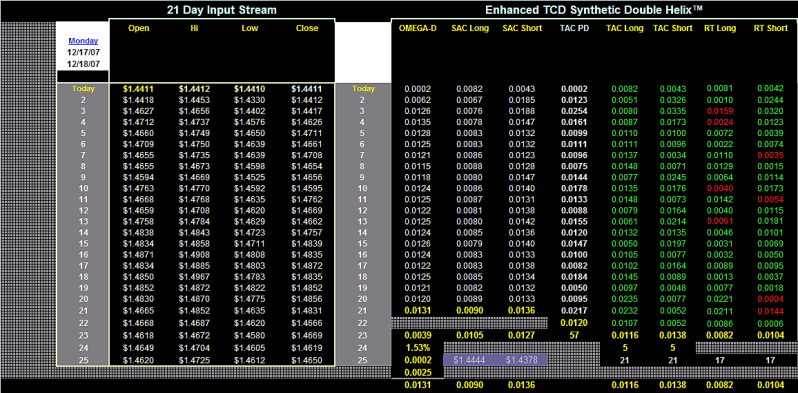
This is the Signal Engine Core. On the left is the 21 Day InputStream from the Real-Time Database.
This part of the Signal Engine uses a maximum of 25 rows of data. You can think of the OHLC format similarly to the way you would think of a Table in a Relational Database (not exactly - but similar in concept). You are looking at the Daily Engine, thus InputStream contains is Daily bars of data. Therefore, row1:colum1 (labeled "Today") = Current Bar. Likewise, row2:column2 (labeled "2") = One Bar Ago; row3:column3 (labeled "3") = Two Bars Ago, and so on, through 25 Bars of Daily data (it takes 25 bars to output 21 values used elsewhere inside the engine). That should be clear as crystal.
The next module is called the "Enhanced TCD Synthetic Double Helix."
Inside this module, you see eight [8] indicators: Omega-D, SAC Long, SAC Short, TAC PD, TAC Long, TAC Short, RT Long and RT Short. The White, Green and Red numbers are real-time inputs used to calculate the Yellow numbers at the bottom of the module. This module uses the data in the InputStream to feed its calculations and near the bottom of the Enhanced TCD Synthetic Double Helix module, are the Indicator's output values (Yellow number). Thus, each Indicator in this particular module outputs a 21 day MovingAverage for each indicator type. When I plot the input values that make up the output values, I get a MovingAverage Line in a chart. Clear as crystal.
The format used here was the standard four (4) digit pip format. So, the Yellow number near the bottom for Omega-D (0.0131) is showing that for this particular range of data, the Omega-D MovingAverage = 131 pips on
that particular date. 90 Pips for SAC Long,
136 Pips for SAC Short,
120 Pips for TAC PD,
116 Pips for TAC Long, etc.
Ok, so that's how I generate my primary TCD values. Now, let's talk about the meaning behind the number. First, the math.
Omega-D (Omega mentioned earlier), is nothing more than a straight MA of the Delta between the
High - Low for X periods (in my case 21 periods), output as a MovingAverage.
The SAC Long is nothing more than the Delta between the
Current High - Low of One Bar Ago for X periods, output as an
Average of the MovingAverage. The SAC Short is the Delta between the
High of One Bar Ago - Current Low for X periods, output as an
Average of the MovingAverage.
The TAC Long, is the Absolute Value Delta between the
Current High - Low of One Bar Ago for X periods, output as a straight
MovingAverage and the TAC Short, is the Absolute Value Delta between the
High of One Bar Ago - Current Low for X periods, output as a straight
MovingAverage.
The RT Long, is the Absolute Value Delta between the
Current Close - Low of 1 Bar Ago for X periods, output as a
MovingAverage. And, the RT Short, is the Absolute Value Delta between the
High of 1 Bar Ago - Current Close for X periods, output as a
MovingAverage.
From the math you can see that SAC-TCD-Long and SAC-TCD-Short move slower than TAC-TCD-Long and TAC-TCD-Short, which in turn moves slower than RT-TCD-Long and RT-TCD-Short.
The Meaning:
Omega = Magnitude
SAC = Slow speed
TAC = Nominal speed
RT = Fast speed
Strategic, Tactical and Real-Time, help to synchronize the Timing aspect of this particular Signal Engine Core Module. So, the first thing to do, is to plot
all four (4) on screen in MT4. Note here that the direction of the calculations in the Engine all produce positive numbers for the TCDs.
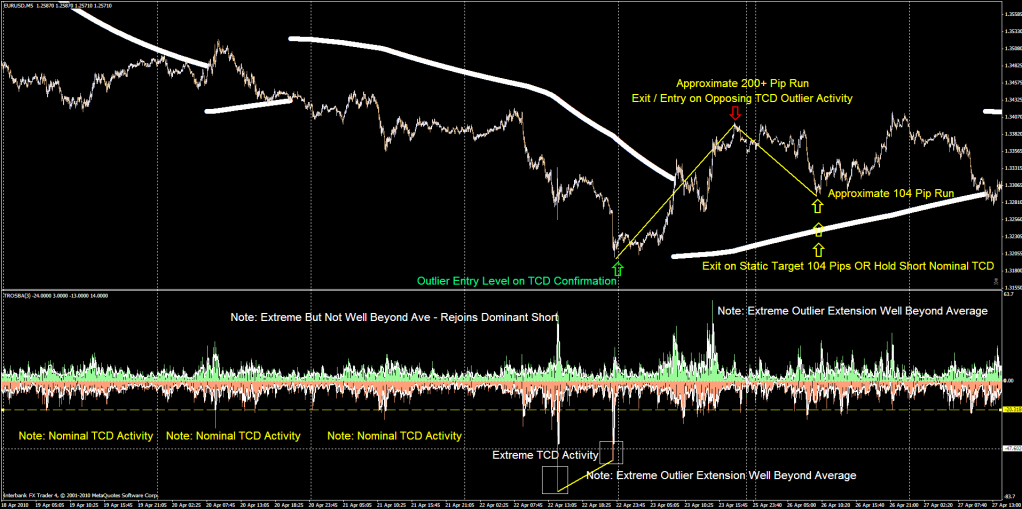
RT TCD is interesting because its calculation connects you to the "future" TCD as it unfolds. Remember, the concept written about under "TCD Fundamentals" earlier in the thread. The "contiguous" language in Transequential Contiguous Delta (TCD), means "connected." Thus, the TCD
always connects the past, present and the future. SAC and TAC both use the Absolute Highs and Absolute Lows of the previous bar and the current bar. However, RT connects the Previous High and Previous Low to the
Current Close. Well, what is the current close, if not the "Next Open." Thus, if you "know" the "next open" value AND you know something about the historicity of the TCD's themselves (their moving averages), then you can extrapolate to "some degree" into the future, or "next bar's" activity to determine what it should do in order to remain intact with its own history.
This is not intuitive at first glance, so re-read if necessary. The RT TCD is
always connected to the Present AND the Future price action of the "next bar," by logical definition. So, RT TCD gives you an instant preview of what the limits or possible outer regions of the "next bar" might look like, based on the historical TCD averaging maintaining its structure and place in history. This is therefore, information the Trader can use when they look at the TAC TCD, when it is reaching its
extreme historical limits. The bigger the bar, the bigger the pop - but also, the bigger the probable draw against the position
before the "next bar" starts to fill-in the RT TCD expected range.
Something to think about, ponder and observe in real-time, before attempting to trade with it. I offer NO trading advice to anyone - merely some of the tools of the "trade" that I use.
Notes:
The only reason I switched the order of calculations previously, was to see what the Histogram might look like, remember. In the system, most of the time, I use a positive value and then invert that value whenever I need to using *-1 as a sort of toggle switch. So, do both. This way, we can look at the pos/neg Histogram as well as the above-zero graphs. Which is better will depend on the user.
Not to worry about TAC PD. That is nothing more than the Tactical version of Omega and I only use it for internal system checks. The other Yellow values are storage values set by the macro at engine update time, so don't worry about those either.
Next Module?
Enhanced DirectionFinder:
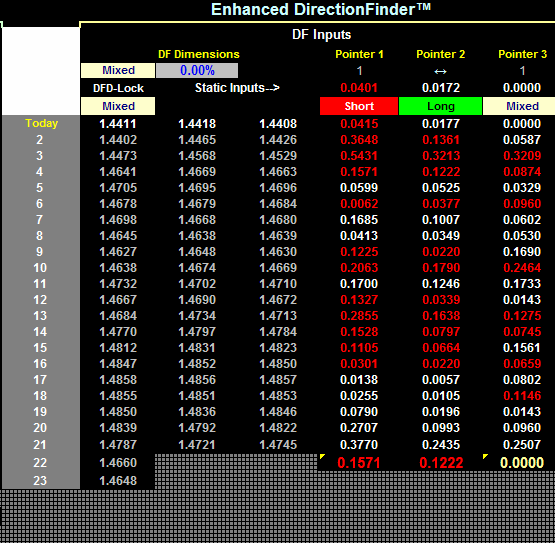
Everything up until now has been fairly straight forward in terms of Excel to MQL. However, things start to steepen with DirectionFinder. It should be a good test of how MQL handles more complex system variables.
Enjoy the South!