

prochargedmopar wrote:MightyOne wrote:TheRumpledOne wrote:Hey MO... I don't understand the difference between the 2 NZD charts. What am I missing?
They both are M5. Is one some type of HA? The black/purple has shorter tails on the bottom than the orange/white chart.
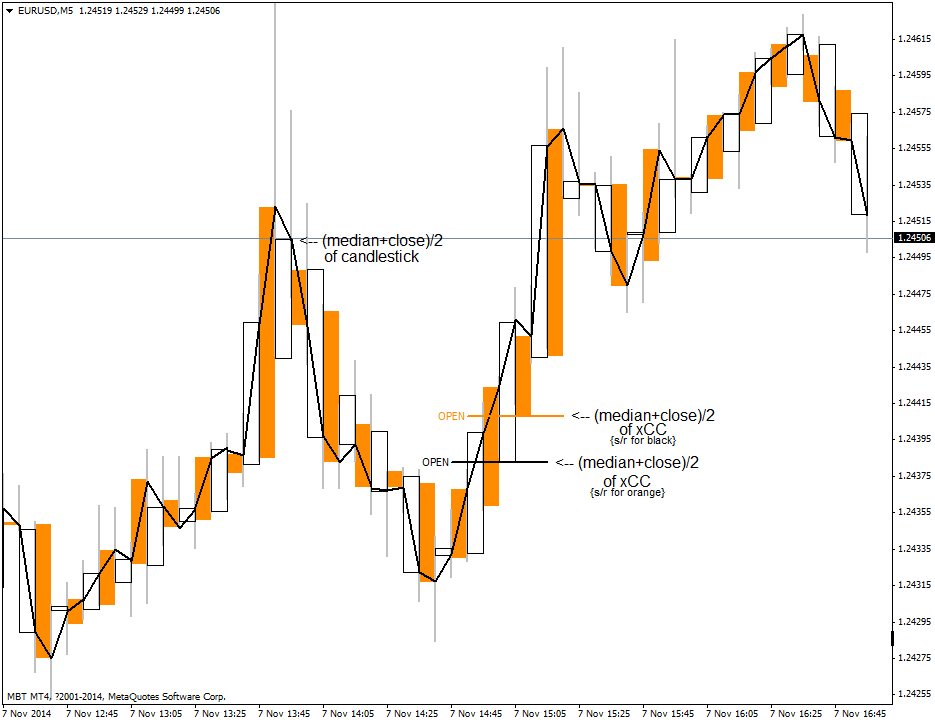
Well sir, on the right we have your trusty candlestick chart with 'perfect opens' (open = prev. close).
On the left we have what seems to be a chart that is impossible to describe
Both the black and orange xCC close at the (midpoint+close)/2 of the candlestick chart and work together to form a line chart; that is to say that when both xCC are on one chart they accurately describe the underlying candlestick chart.
If there were only one color then it would be a true CC, candles would be skipped, and it would be a higher chart period.
The chart reduces the visible volatility in two ways:
1) by shifting the open and close to an average, xCC that try to reverse or saw about are dramatically reduced in size; weakening the appearance of weak moves accentuates the strong moves.
2) the 'line chart' is then divided into two colors to give the illusion of a higher chart period & artificial opens are given to turn the lines into something that we can read and understand; candles!
Since individually the CC look like a higher period it tricks your eyes into not seeing so many zigzags.
For more information please see the mq4 file
How much "higher" of a timeframe is our brain seeing?
Why not just look at a higher timeframe chart?
A xCC will look like the period of a single CC; 2xCC = double the period.
A 2xCC is sort of like having an M15 & M30 on the same chart; orange is 15 minutes & black is 30 minutes.
The 15 minute candle closes with orange, then the 30 minute closes with black, the 15 with orange, and so on.
From black to black or orange to orange xCC you see groups of 30 minutes but together, as they alternate, they retain the movement of the 15 minute chart.
That said, you cannot simply put an M15 and M30 chart side by side to get the same effect because a xCC is so much more than that simple explanation.
It is not trying to double the period, it is only better expressing the underlying chart.
Candlesticks are to bar charts as xCC is to candlesticks.


.gif "Mark-12")


