Hi News,
Couple of points.
I have mentioned in the thread and Mo has somewhere a long time ago, use multiples of 4-5 at most. Using the 5 min as a entry chart then use a bias of 4-5 times that max if you want to keep your SL's tight.
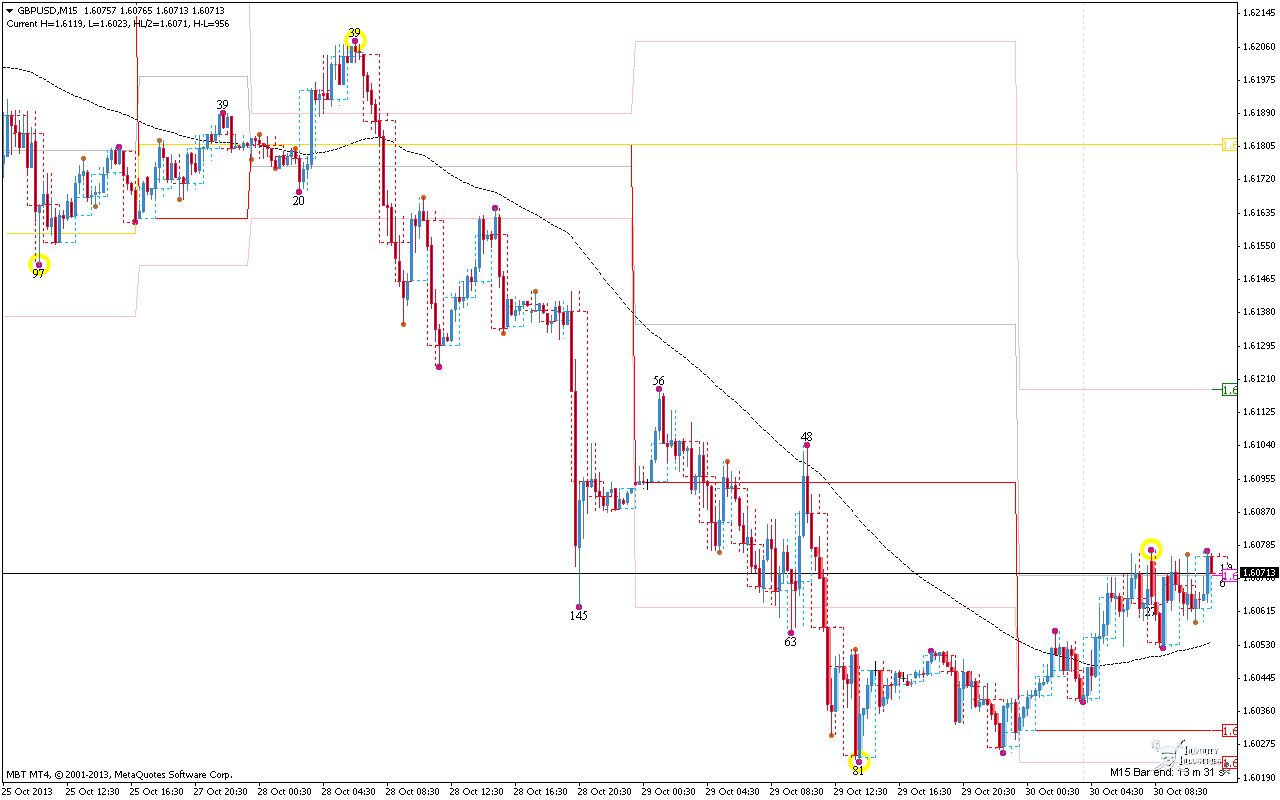
Couple post back, bias, lower high, lower low for possible bias change
Using the 1-4 hr, your right it is bearish, but you trade larger SL's with those time frames.
Takes lots of practice to use the RB'S as a bias. Start with something easier. (MACD)
I liked Mo's comment a few post back about simplicity. To me bias is simple but explaining it, the challenge.
My advice is pick one way to determine bias and stick with it. I recommend the macd. We dont trade the crosses, we use it as a momentum bias direction and the RB's as the entry style on a lower time frame.
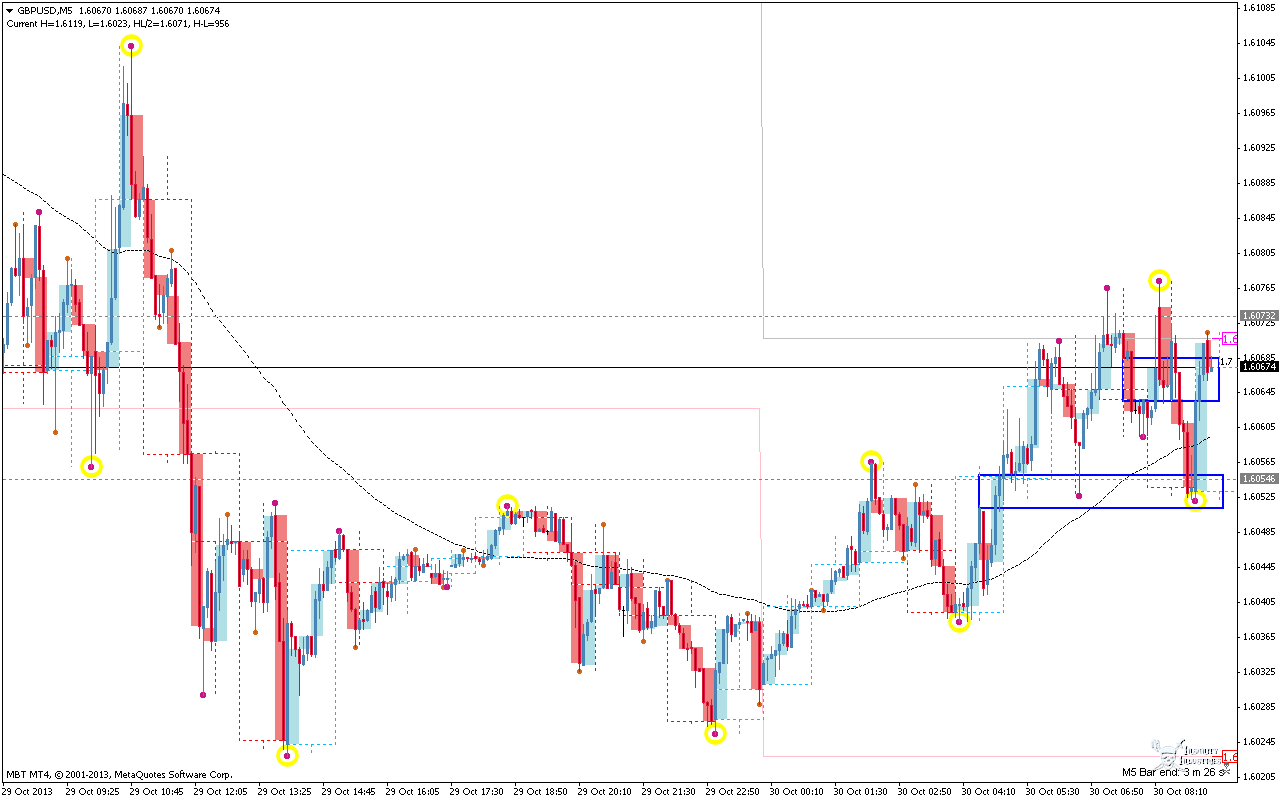
As you know I hate overlays... so I change the numbers of any indicator to reflect the higher time frames on my entry time based chart.
That being said, look at my macd, its reflecting about a 7-9 min time frame on a 5 min entry chart. Multiple of 4-5 would be a 25 min chart max for bias. I like short ones because I scalp.
I mark the RB's, ignoring most that dont follow the bias. For the next week I will only post this template so you can see the consistancy and simplicity.
newscalper wrote:Right the whole bias thing.
My bias here is short right. Why? Because there is an H1 down zone right there. Also on H4 there's one too.
But,
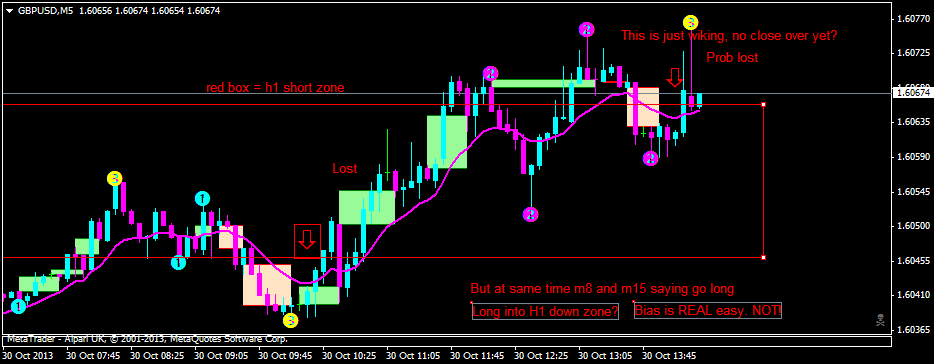
Short trades failed. Then price goes up and through the zone, shift bias long. Right? Why MACD is long, M15 is long but is tht H1 box just being wicked to the upside, plus it's still within the H4 box??
Now price is above the H1 zone but still inside the H4 zone, MACD saying up, M15 saying up, M5 saying down. LOL. So bias up or down?
Who knows?