
me? or bb, or someone else?

Moderator: moderators
prochargedmopar wrote:MightyOne wrote:You cannot (I cannot) trade space with 1 lot...
2 lots maybe, but even then you are stuck with the 1
lot short-stick after a partial stop or TP.
3 lots is as low as you can possible go without severely limiting your
strategical options.
Your exact entry doesn't matter, this does:
#1: Position in the market
#2: Position Size prior to range expansion
#3: Range expansion
Your job is 1 & 2.
Who is your Dad?


MightyOne wrote:prochargedmopar wrote:MightyOne wrote:You cannot (I cannot) trade space with 1 lot...
2 lots maybe, but even then you are stuck with the 1
lot short-stick after a partial stop or TP.
3 lots is as low as you can possible go without severely limiting your
strategical options.
Your exact entry doesn't matter, this does:
#1: Position in the market
#2: Position Size prior to range expansion
#3: Range expansion
Your job is 1 & 2.
Who is your Dad?
What!?
Matthew 23:9
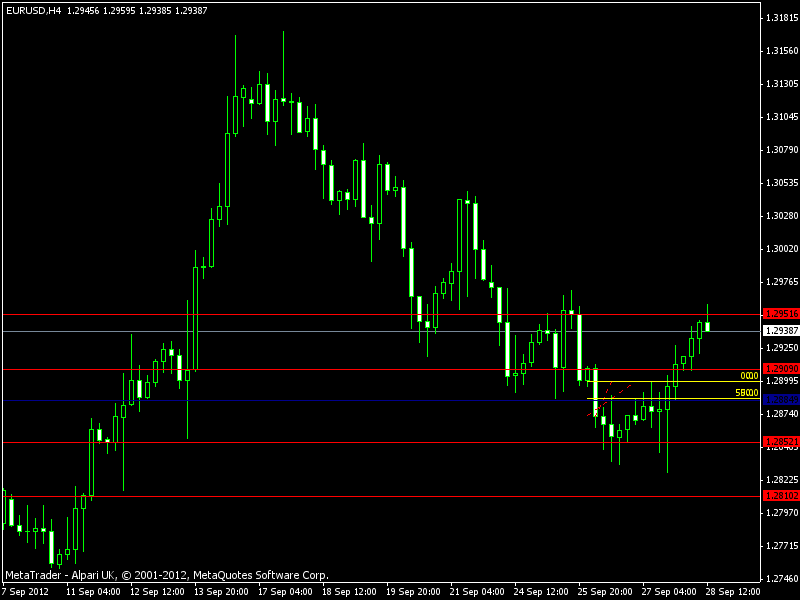
newscalper wrote:Well the level held and it went up like stink
Now approaching H4 zline - yesterday was up and the 50% fib is below, but not looking for shorts from the H4 Zline just hitting now? In this instance what is the significance of that daily fib? Or is that just a confluence thing?
I know what you meant about the H4 candle to the left marking the zone as the momo candle perhaps wasn't great BUT individual H4 bars mean diddly, no-one sees them the same. What I did see was the original return to the area with what appeared as a doji but with a BIG wick in both directions then 7 green H4 bars. Also the daily chart showed a momo bar (almost) from that area. So short trades were going into a daily demand area.
So one TF says short, another says long so exit criteria is key because if you entered on M15 and were hoping to hold for more you jsut got smashed. If you entered on M15 and only took 20 pips or whatever then..OK
bettlebox wrote:Plus there was 2 x 15min zline bang on at rat trade.. Smaller timeframe orderzones with in higher timeframe orderzones works a treat.
newscalper wrote:Well the level held and it went up like stink
Now approaching H4 zline - yesterday was up and the 50% fib is below, but not looking for shorts from the H4 Zline just hitting now? In this instance what is the significance of that daily fib? Or is that just a confluence thing?
I know what you meant about the H4 candle to the left marking the zone as the momo candle perhaps wasn't great BUT individual H4 bars mean diddly, no-one sees them the same. What I did see was the original return to the area with what appeared as a doji but with a BIG wick in both directions then 7 green H4 bars. Also the daily chart showed a momo bar (almost) from that area. So short trades were going into a daily demand area.
So one TF says short, another says long so exit criteria is key because if you entered on M15 and were hoping to hold for more you jsut got smashed. If you entered on M15 and only took 20 pips or whatever then..OK
prochargedmopar wrote:MightyOne wrote:prochargedmopar wrote:MightyOne wrote:You cannot (I cannot) trade space with 1 lot...
2 lots maybe, but even then you are stuck with the 1
lot short-stick after a partial stop or TP.
3 lots is as low as you can possible go without severely limiting your
strategical options.
Your exact entry doesn't matter, this does:
#1: Position in the market
#2: Position Size prior to range expansion
#3: Range expansion
Your job is 1 & 2.
Who is your Dad?
What!?
Matthew 23:9
Wrong "Father".
You know who you looked up to as a little boy, No matter what spin you put on it now.
He may not be as good a trader as you, but he is still 50% of where you came from.
newscalper wrote:bettlebox wrote:Plus there was 2 x 15min zline bang on at rat trade.newscalper wrote:Well the level held and it went up like stink
Now approaching H4 zline - yesterday was up and the 50% fib is below, but not looking for shorts from the H4 Zline just hitting now? In this instance what is the significance of that daily fib? Or is that just a confluence thing?
I know what you meant about the H4 candle to the left marking the zone as the momo candle perhaps wasn't great BUT individual H4 bars mean diddly, no-one sees them the same. What I did see was the original return to the area with what appeared as a doji but with a BIG wick in both directions then 7 green H4 bars. Also the daily chart showed a momo bar (almost) from that area. So short trades were going into a daily demand area.
So one TF says short, another says long so exit criteria is key because if you entered on M15 and were hoping to hold for more you jsut got smashed. If you entered on M15 and only took 20 pips or whatever then..OK
Which daily 50% level - I thought you just marked out the 50% level of the day before on the previous chart approx where the pivot was? Now it looks like you're marking 50% of a daily momo which was days ago?


