This is where I've gotten confused with this. Now I know ideally I should have been looking for longs after the good H4 close up at the bottom but as usual

it was when I was asleep. Now there's further H4 momo which MAY signal further longs after pullback. So good so far.
H4 chart showing fibs and Zline

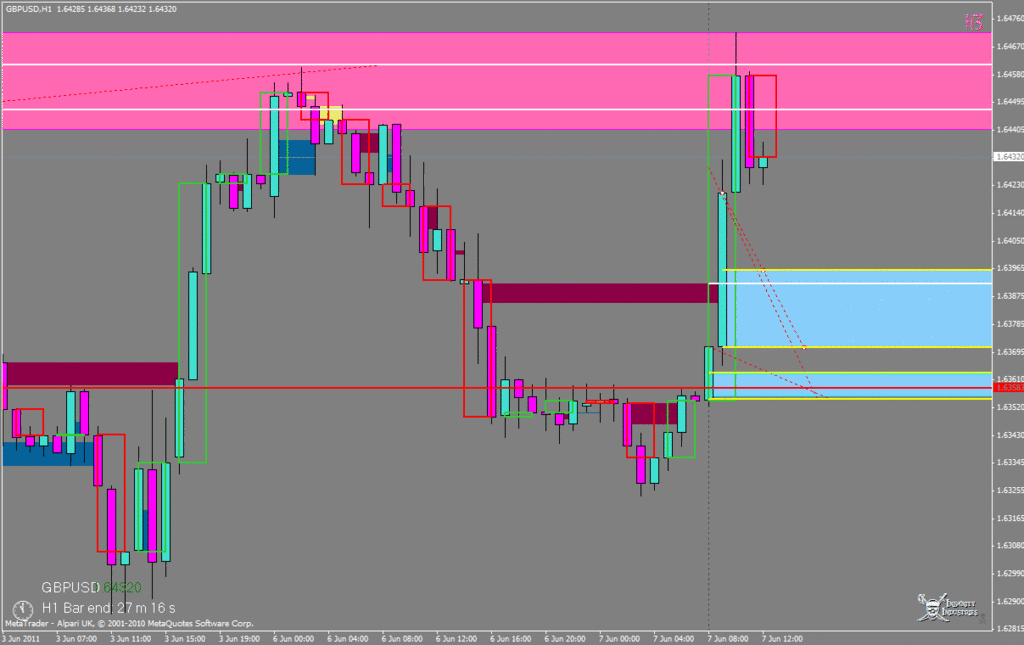
H1 chart, showing H1 momos and Zlines within the H4 Mighty Zone, theres 2 of them:
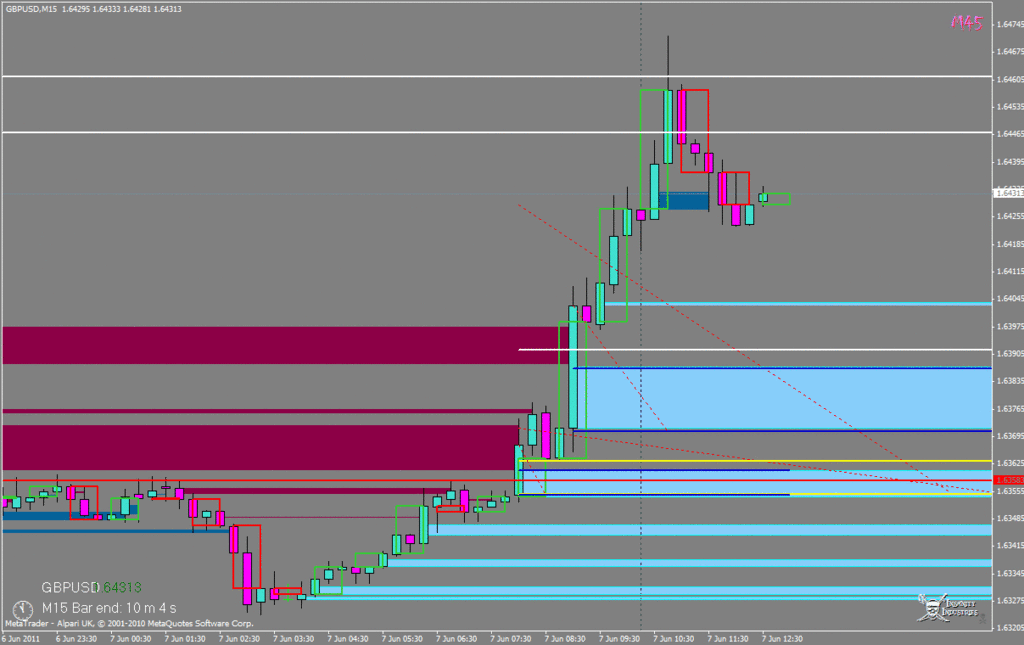
M15 chart, it's now getting pretty crazy. I'm looking for price to cross a line...hmm, which one, plus there are lots of little zones above the H4 50% area where price could well bounce and go long from?
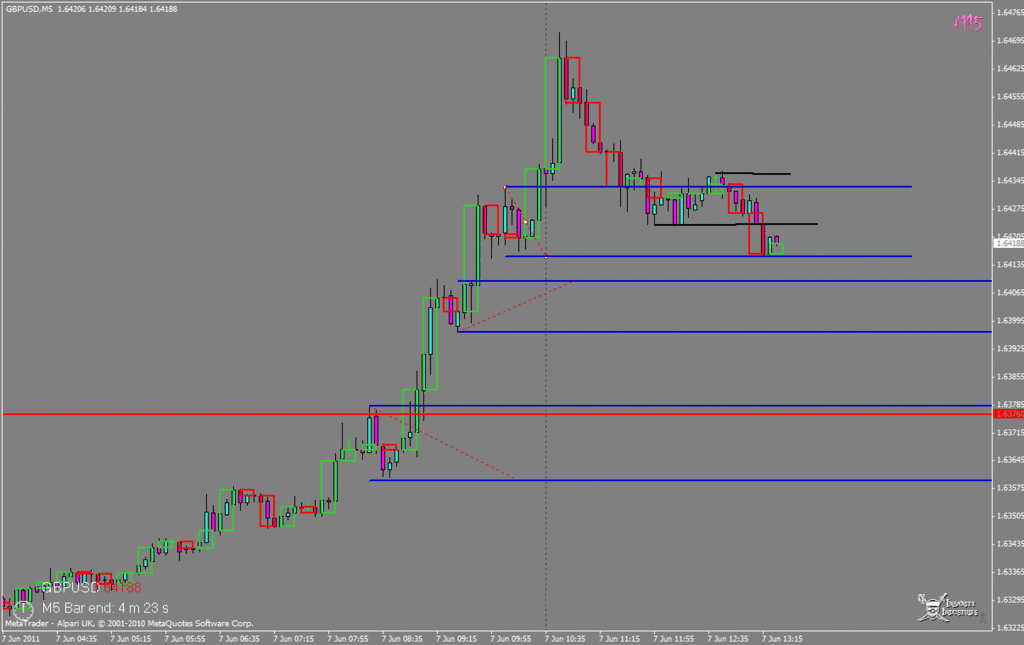
M5 chart using custom candle (really just a refinement of M15 but can see near term momo better)

Price closes under and then over a line. Great, no problem with that. Which line is often my problem?