Blind Mouse Strategy
Moderator: moderators


Please add www.kreslik.com to your ad blocker white list.
Thank you for your support.
Thank you for your support.


PTG wrote:Apparently there is some confusion, where this really need not be the case. In fact, it is so simple that it becomes hard to explain. Let me try anyway.
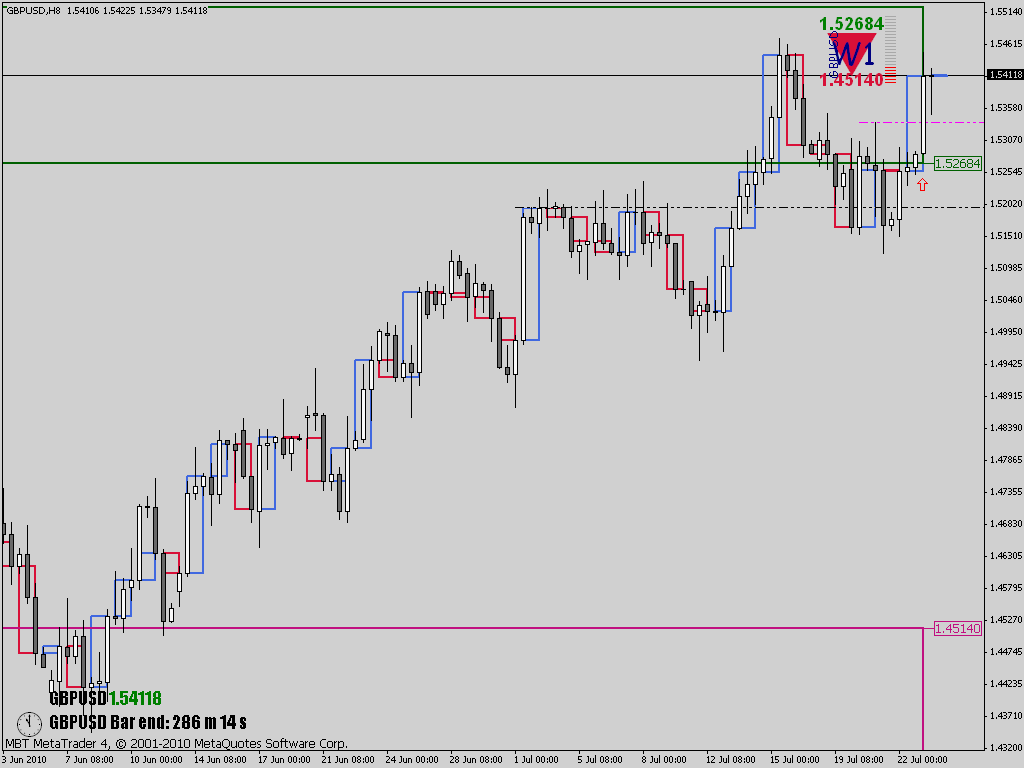
Here is the picture again:
This picture combines two things in one, namely a) the further the next candle intrudes into the range of the LRC (Long Range Candle) (aka pullback), the weaker the combination of the two becomes, and b) depending on where you define your S/R, you could increase the money you risk. The further price penetrates, the less extra you should risk, becuase the combination of the candles becomes weaker.
Re. b): the principle is to start with a risk of X pips in the morning. You gain e.g. 3X Pips, that you then can invest again. You play the money you gained in the market, in other words. In case you lose, you are back at 0. In case you win and make another RR of 3:1, you have 9X at your disposal.
The picture is related to this. It is also related to how severe the pullback is. The further the pullback, the weaker the case for a continuation of the previous direction, in the case of the picture to the upside.
In the extreme case it closes lower than 0%, in which case you want to look for trades in the other direction. In other words: you want to see a pullback that is as small as possible for a continuaton of the previous direction. The smaller the pullback, the more extra you can risk.
The S&R lines are personal choices. They don't differ from what are considered to be "normal" S&R. The truth of the matter is, that everybody will draw their own S&R lines. Whatever you do, it is subjective. At the end of the day, they are but lines in the sand; an objective limit where you base your decisions on. Price closes above or below any horizontal line you draw, no matter where. You act according to your defined rules in those cases, again and again.
The picture is related to a continuation to the upside (long). In case price does NOT close below the line in the sand, you add money proportional to the success rate of a pullback. The further the pullback, the lower the successrate, the less extra money you should add.
FYI here are a couple of pictures that are also related to this issue as well as the custom candles. All of this, my friends, is old wine in new bags.
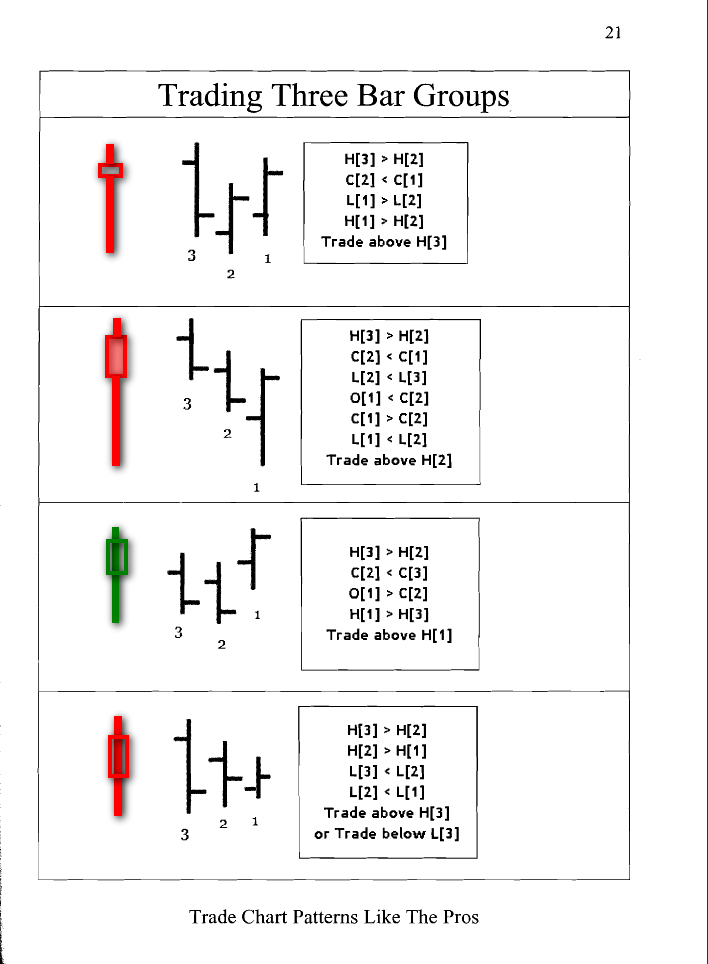
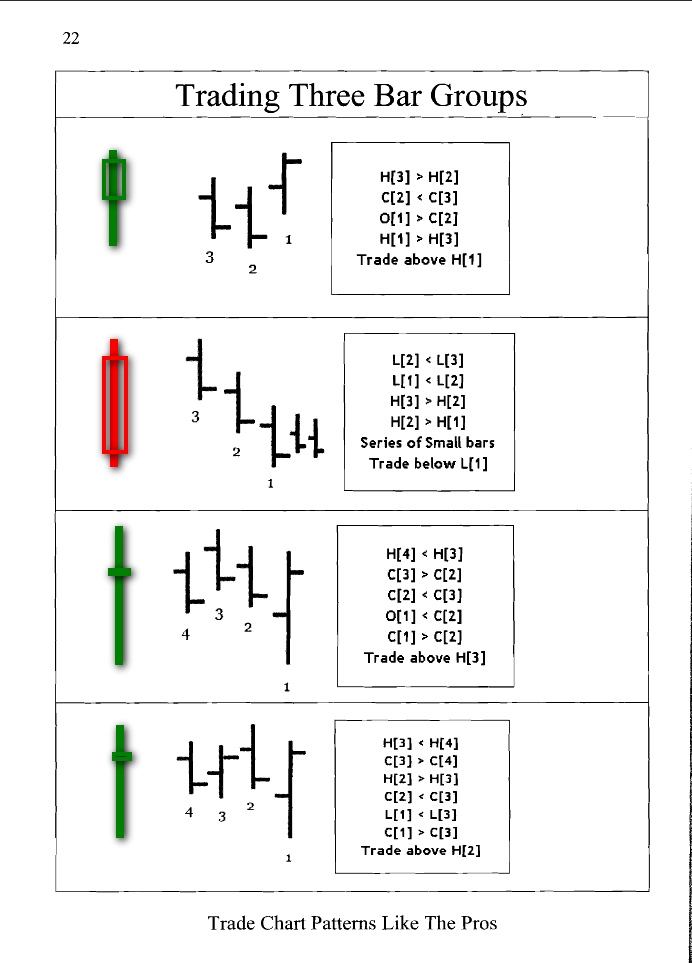
Remember: a candle is just a candle. Price is fractal: two or three or Y candles are also just a (as in: one) candle. Take the open, high, low, close of any group of candles, and think of what it depicts: are the sellers in control, are the buyers in control, or is it neutral. Take the open, high, low, close of a particular timeframe, and you can draw a candle.
Hope this helps, and don't forget to go and search for yourself for the answers. You need to take responsibility of your life and therefore of your trading

Hopefully they understand what you are saying
TheRumpledOne wrote:MightyOne wrote:newark18 wrote:MightyOne wrote:
At first glance, my reaction is huh? I thought S&R lines were derived from candle closes. And I see conflict between: (1) 50% mark is S&R used when doubling position; and (2) S&R line is your average price.
If someone who understands this chart can speak in nongenious terms then I would appreciate an explanation.
If you double your position then your average price is the midpoint between your first and second order making a 50% RET your line of S&R...
"If a RED candle close OVER support then it is not support"
Are you referring to a short trade?
Once again, I am confused.
P.S. Where is the googletalk chat?
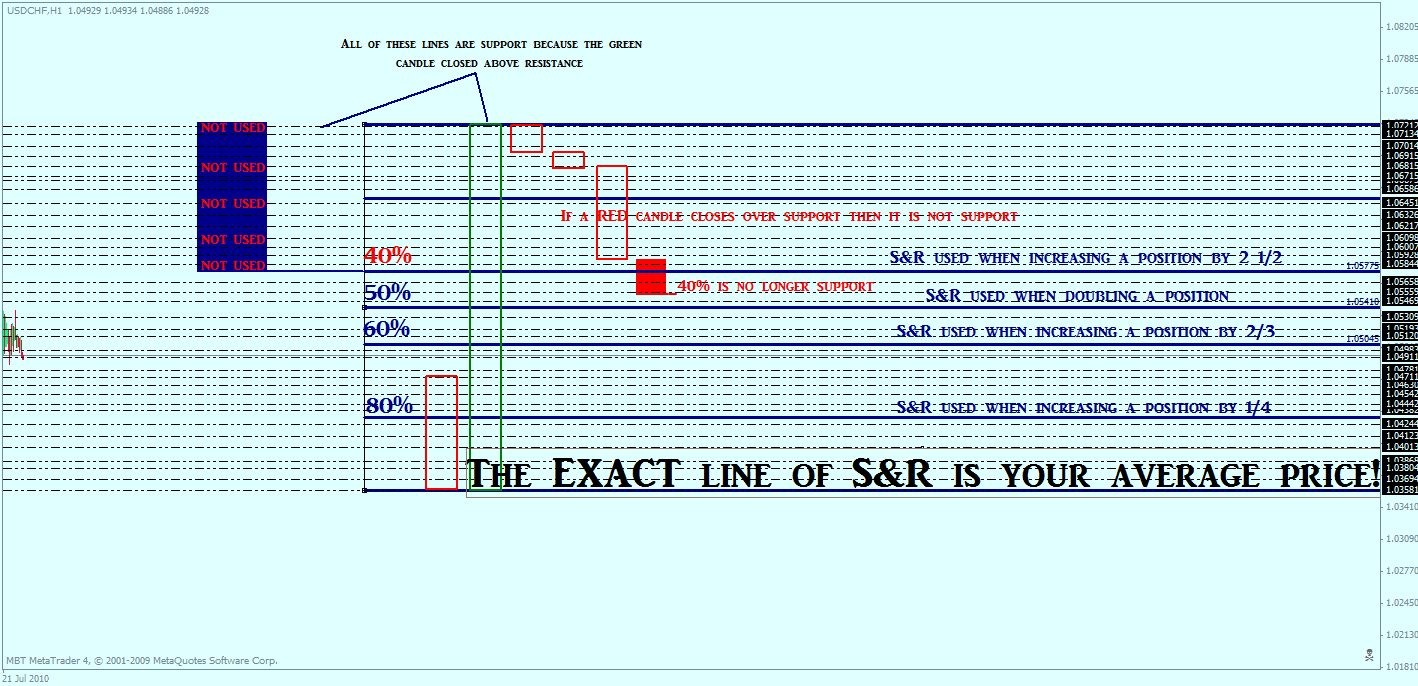
Support is a line which price does not close below.
Resistance is a line which price does not close above.
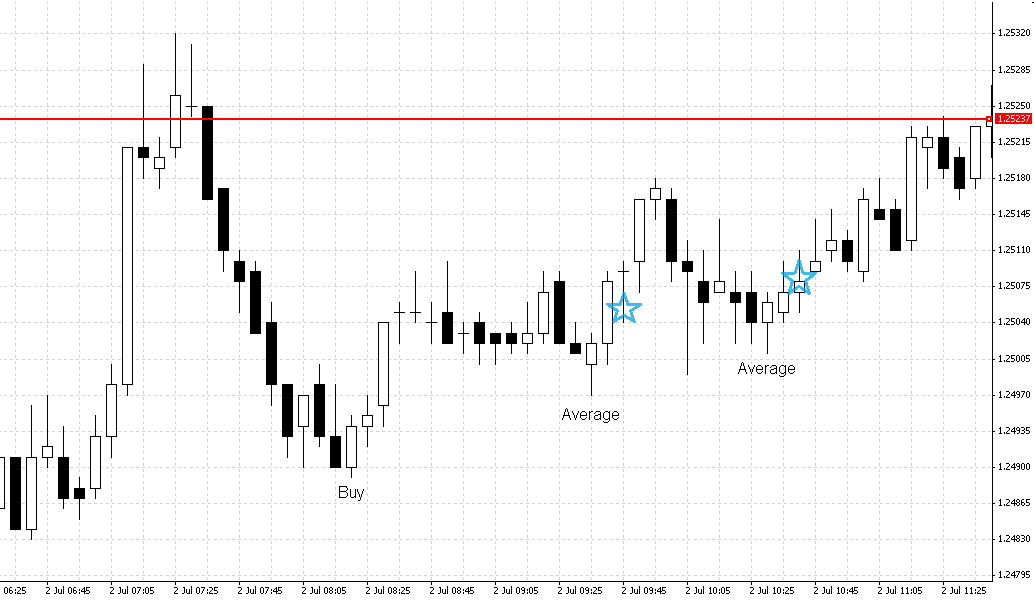
newark18 wrote:I always averaged into my order basically as price was retracing. Do you mean to say that I should first wait for the retracement and average into your order after you think the retracement is complete?
IMHO yes.
"Support is a line which price does not close below." In an up move the retracement should not close below your line. If it does then the line was not support and/or the move down is more than a retracement. Either way why would you still average into a long position.
Is price closing higher or lower than something? Simple yet powerful question. ..MO
Please add www.kreslik.com to your ad blocker white list.
Thank you for your support.
Thank you for your support.


good explanation PTG!
Increace your risk after you can play with market money! Thats one of the key concepts!
Yesterday i made 30% on equity. Today increased my risklevel to this 30%. And its gooing well so far (up 30%). I know small win for the new risk level. But if the momo is not holding im too scared to hold on to the position...
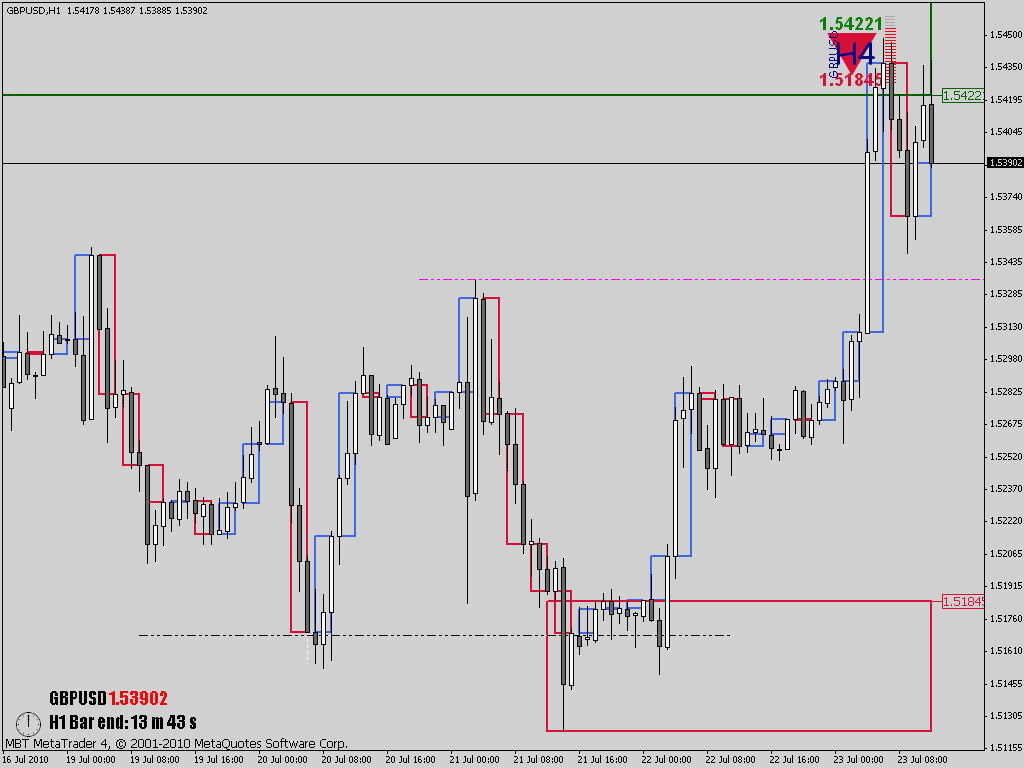
PTG wrote:Apparently there is some confusion, where this really need not be the case. In fact, it is so simple that it becomes hard to explain. Let me try anyway.
Here is the picture again:
This picture combines two things in one, namely a) the further the next candle intrudes into the range of the LRC (Long Range Candle) (aka pullback), the weaker the combination of the two becomes, and b) depending on where you define your S/R, you could increase the money you risk. The further price penetrates, the less extra you should risk, becuase the combination of the candles becomes weaker.
Re. b): the principle is to start with a risk of X pips in the morning. You gain e.g. 3X Pips, that you then can invest again. You play the money you gained in the market, in other words. In case you lose, you are back at 0. In case you win and make another RR of 3:1, you have 9X at your disposal.
The picture is related to this. It is also related to how severe the pullback is. The further the pullback, the weaker the case for a continuation of the previous direction, in the case of the picture to the upside.
In the extreme case it closes lower than 0%, in which case you want to look for trades in the other direction. In other words: you want to see a pullback that is as small as possible for a continuaton of the previous direction. The smaller the pullback, the more extra you can risk.
The S&R lines are personal choices. They don't differ from what are considered to be "normal" S&R. The truth of the matter is, that everybody will draw their own S&R lines. Whatever you do, it is subjective. At the end of the day, they are but lines in the sand; an objective limit where you base your decisions on. Price closes above or below any horizontal line you draw, no matter where. You act according to your defined rules in those cases, again and again.
The picture is related to a continuation to the upside (long). In case price does NOT close below the line in the sand, you add money proportional to the success rate of a pullback. The further the pullback, the lower the successrate, the less extra money you should add.
FYI here are a couple of pictures that are also related to this issue as well as the custom candles. All of this, my friends, is old wine in new bags.
Remember: a candle is just a candle. Price is fractal: two or three or Y candles are also just a (as in: one) candle. Take the open, high, low, close of any group of candles, and think of what it depicts: are the sellers in control, are the buyers in control, or is it neutral. Take the open, high, low, close of a particular timeframe, and you can draw a candle.
Hope this helps, and don't forget to go and search for yourself for the answers. You need to take responsibility of your life and therefore of your trading
Lose professionally!
-
TygerKrane

- rank: 1000+ posts

- Posts: 1733
- Joined: Mon Jan 25, 2010 3:36 pm
- Reputation: 297
- Location: Long Island, NY
- Gender:

Placing Your Average Line...
Humble wrote:newark18 wrote:I always averaged into my order basically as price was retracing. Do you mean to say that I should first wait for the retracement and average into your order after you think the retracement is complete?
IMHO yes.
"Support is a line which price does not close below." In an up move the retracement should not close below your line. If it does then the line was not support and/or the move down is more than a retracement. Either way why would you still average into a long position.
Thanks newark18, I was on the verge of asking the same question.
[hr]So are we saying, "look to create your Average Line AFTER you think that the retracement has happened?"
I must admit, I had been looking at previous consolidation levels, and placing my order to create the average (based on those previous areas) while price was still on its rise, and then seeing if price would pull back far enough for me to have to close out on the trade.
I must admit, giving the Price Action the chance form its own retracement {S/R} level FIRST and THEN placing my average line based on that is a lot less stressful.
See my markup of aliassmith's picture as a confirmation of what we should be trying to do then?:
**Krane catches Tyger** !>I'm here to chew bubble gum and make major pips...and I'm all out of bubble gum.<!
Re: Placing Your Average Line...
TygerKrane wrote:Humble wrote:newark18 wrote:I always averaged into my order basically as price was retracing. Do you mean to say that I should first wait for the retracement and average into your order after you think the retracement is complete?
IMHO yes.
"Support is a line which price does not close below." In an up move the retracement should not close below your line. If it does then the line was not support and/or the move down is more than a retracement. Either way why would you still average into a long position.
Thanks newark18, I was on the verge of asking the same question.
[hr]So are we saying, "look to create your Average Line AFTER you think that the retracement has happened?"
I must admit, I had been looking at previous consolidation levels, and placing my order to create the average (based on those previous areas) while price was still on its rise, and then seeing if price would pull back far enough for me to have to close out on the trade.
I must admit, giving the Price Action the chance form its own retracement {S/R} level FIRST and THEN placing my average line based on that is a lot less stressful.
See my markup of aliassmith's picture as a confirmation of what we should be trying to do then?:
The best way to explain it is that you go back in time and place order at a level where you wish you had entered into the market.
Please add www.kreslik.com to your ad blocker white list.
Thank you for your support.
Thank you for your support.