MO's MBT Micro

free & uncensored discussion arena for TheRumpledOne

Moderator: moderators

franck
rank: 50+ posts
rank: 50+ posts
Posts: 57
Joined: Tue Jun 09, 2009 6:13 pm
Reputation: 2
Gender: None specified

Postby franck » Wed Apr 28, 2010 4:35 am

I am stealing it too :) because this is it.

* Price either goes up or down.
* No one knows what will happen next.
* Keep losses small and let winners run.
* POSITION SIZE = RISK / STOP LOSS
* The reason you entered has no bearing on the outcome of your trade.
* You can control the size of your loss (skill) but you can't control the size of your win (luck).
* You need to know when to pick up your chips and cash them in.

For precision freaks, lets see if this chart is helpful. Its from what i perceived from MO's chart.


1) it starts from 2 GOOD points, and give an angle. Applies to all timeframe. Angle = give a sense of momentum, since it measures pips/time. Watch the changes of these angles. With MO rules, we can anticipate change of angle and look for it.

2) The envelopes of equilibrium then gives the projection points. When price reaches these projection points = decision points. What are these points? they are usually WICK points of a bar.

3) For more precision, when price does overshoot the decision points esp at the max of a range eg m15 plus time sales, DO the TRIGGER and put on MO exit rules.

Why does price move like this? ;)
* anyOne can be prOfitable tradING ANY line. see it?

Please add www.kreslik.com to your ad blocker white list.
Thank you for your support.

User avatar
MightyOne
rank: 5000+ posts
rank: 5000+ posts
Posts: 6055
Joined: Wed Dec 10, 2008 6:33 pm
Reputation: 560
Gender: Male

Postby MightyOne » Wed Apr 28, 2010 4:52 am

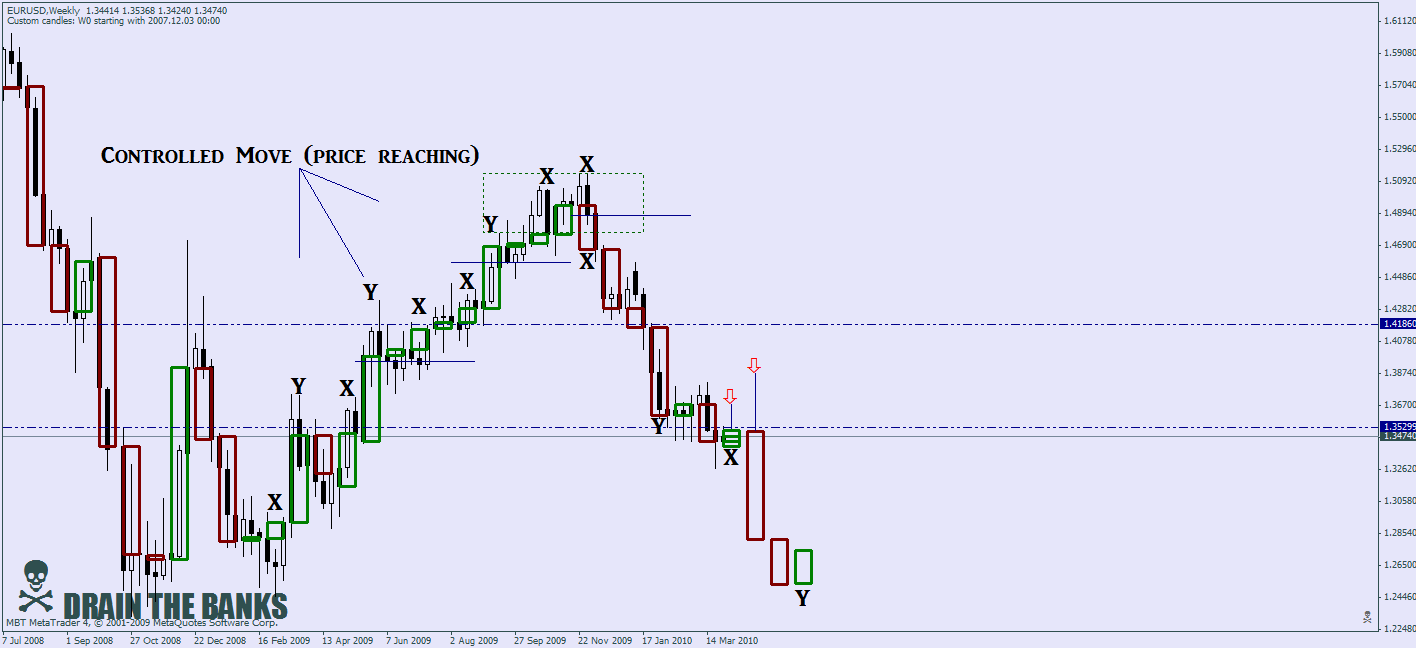
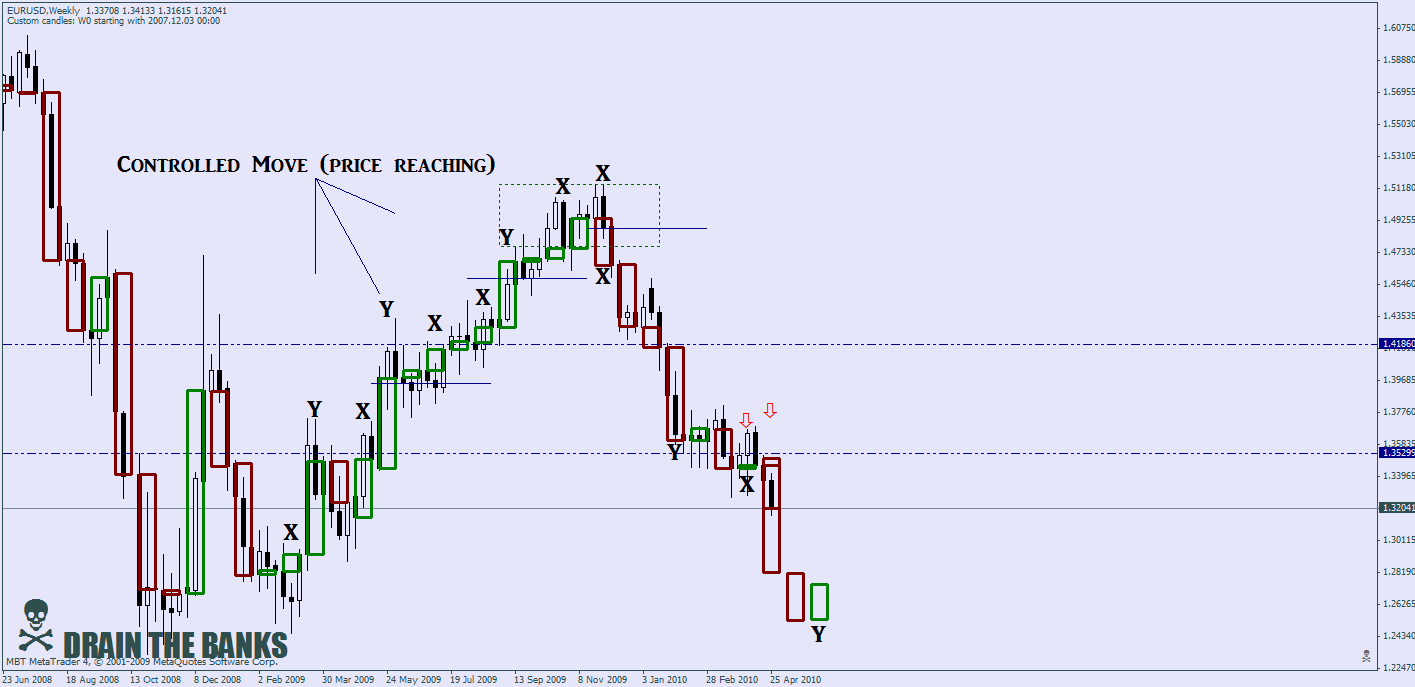
Do you remember this picture?

I said that I expected X momo for the next 2 weeks and then for momentum to continue short on the EU.

I drew lines with arrows and said that I would be trading off the weekly high extremes.

Image


500 pips later:


Image


Let us see if the XY pattern holds...

User avatar
bacoazul
rank: 150+ posts
rank: 150+ posts
Posts: 259
Joined: Wed Sep 30, 2009 12:31 pm
Reputation: 10
Gender: Male

Postby bacoazul » Wed Apr 28, 2010 5:00 am

MightyOne wrote:Do you remember this picture?

I said that I expected X momo for the next 2 weeks and then for momentum to continue short on the EU.

I drew lines with arrows and said that I would be trading off the weekly high extremes.

Image


500 pips later:


Image


Let us see if the XY pattern holds...


:shock: :shock: :shock:
These are my principles. If you don't like them, I have others.

franck
rank: 50+ posts
rank: 50+ posts
Posts: 57
Joined: Tue Jun 09, 2009 6:13 pm
Reputation: 2
Gender: None specified

Postby franck » Wed Apr 28, 2010 5:18 am

*Clicked on wrong button* Its below.
Last edited by franck on Wed Apr 28, 2010 5:35 am, edited 1 time in total.
* anyOne can be prOfitable tradING ANY line. see it?

franck
rank: 50+ posts
rank: 50+ posts
Posts: 57
Joined: Tue Jun 09, 2009 6:13 pm
Reputation: 2
Gender: None specified

Postby franck » Wed Apr 28, 2010 5:24 am

The advantage of using 2 points aims to get to the source since all price starts from M1 as early as possible.

1) Early changes in the angle gives the feel of change in flow which precedes price.

2) Projection Points.

Powerful!


The pink boxes are examples of overshoots. The charts are meant for examples and for precision freaks :) *i use TRO m5 rat* To trade it, there should be at least a MO bar (higher timeframe) to start a hug.

Thanks MO!
* anyOne can be prOfitable tradING ANY line. see it?

Please add www.kreslik.com to your ad blocker white list.
Thank you for your support.

franck
rank: 50+ posts
rank: 50+ posts
Posts: 57
Joined: Tue Jun 09, 2009 6:13 pm
Reputation: 2
Gender: None specified

Postby franck » Thu Apr 29, 2010 9:19 am

it all starts from 2 points (or a triangle).


45/17.5 from H1, then 35/70 from M15 and view from m5.
* anyOne can be prOfitable tradING ANY line. see it?

franck
rank: 50+ posts
rank: 50+ posts
Posts: 57
Joined: Tue Jun 09, 2009 6:13 pm
Reputation: 2
Gender: None specified

Postby franck » Thu Apr 29, 2010 12:57 pm

it is worth the wait. better lucky than good.


More before after pictures?
* anyOne can be prOfitable tradING ANY line. see it?

franck
rank: 50+ posts
rank: 50+ posts
Posts: 57
Joined: Tue Jun 09, 2009 6:13 pm
Reputation: 2
Gender: None specified

Postby franck » Fri Apr 30, 2010 12:46 am

franck wrote:it all starts from 2 points (or a triangle).


45/22.5 from H1, then 35/70 from M15 and view from m5.


30/4/2010 : i labelled wrongly. half of 45 is 22.5.
* anyOne can be prOfitable tradING ANY line. see it?

franck
rank: 50+ posts
rank: 50+ posts
Posts: 57
Joined: Tue Jun 09, 2009 6:13 pm
Reputation: 2
Gender: None specified

Postby franck » Fri Apr 30, 2010 4:24 am

1. One timeframe. Higher timeframe preferably, but longer wait. Follow by one smaller.

2. 2 good points gives an angle.

3. 2 parallel lines gives the equilibrium channel.

4a. New good points formation
- confirms the channel? OR
- new angle formation?

4b. The first angle gives the next anticipated 1/2x angle OR 2x angle, which can be used to draw into the the right side of a chart. Good for HOOK anticipation.

5. Watch and open up a can of beer.
* anyOne can be prOfitable tradING ANY line. see it?

User avatar
MightyOne
rank: 5000+ posts
rank: 5000+ posts
Posts: 6055
Joined: Wed Dec 10, 2008 6:33 pm
Reputation: 560
Gender: Male

Postby MightyOne » Fri Apr 30, 2010 5:32 am

franck wrote:1. One timeframe. Higher timeframe preferably, but longer wait. Follow by one smaller.

2. 2 good points gives an angle.

3. 2 parallel lines gives the equilibrium channel.

4a. New good points formation
- confirms the channel? OR
- new angle formation?

4b. The first angle gives the next anticipated 1/2x angle OR 2x angle, which can be used to draw into the the right side of a chart. Good for HOOK anticipation.

5. Watch and open up a can of beer.


Diagonal lines are the last thing on my mind.

The first thing I do when I sit down is throw up blubbb's custom candle indicator and look for combined candle XY in multiple time frames.

I then consider the equilibrium lines and mark the Cash Zone.

I use multiple entries starting with custom candle rats.


You can do a lot of things with diagonal lines, I simply use them to get a feel for how the chart is moving and if price is over extended.

Some things are just "background information" so I do fewer things that I will regret later :lol:

Please add www.kreslik.com to your ad blocker white list.
Thank you for your support.


Return to “TheRumpledOne”