Pro Trader wrote:roger_over wrote:Hi Pro , Do you find that you have more winning trades when you do trade with the W1 and H1 being the correct colour? Enjoy your posts
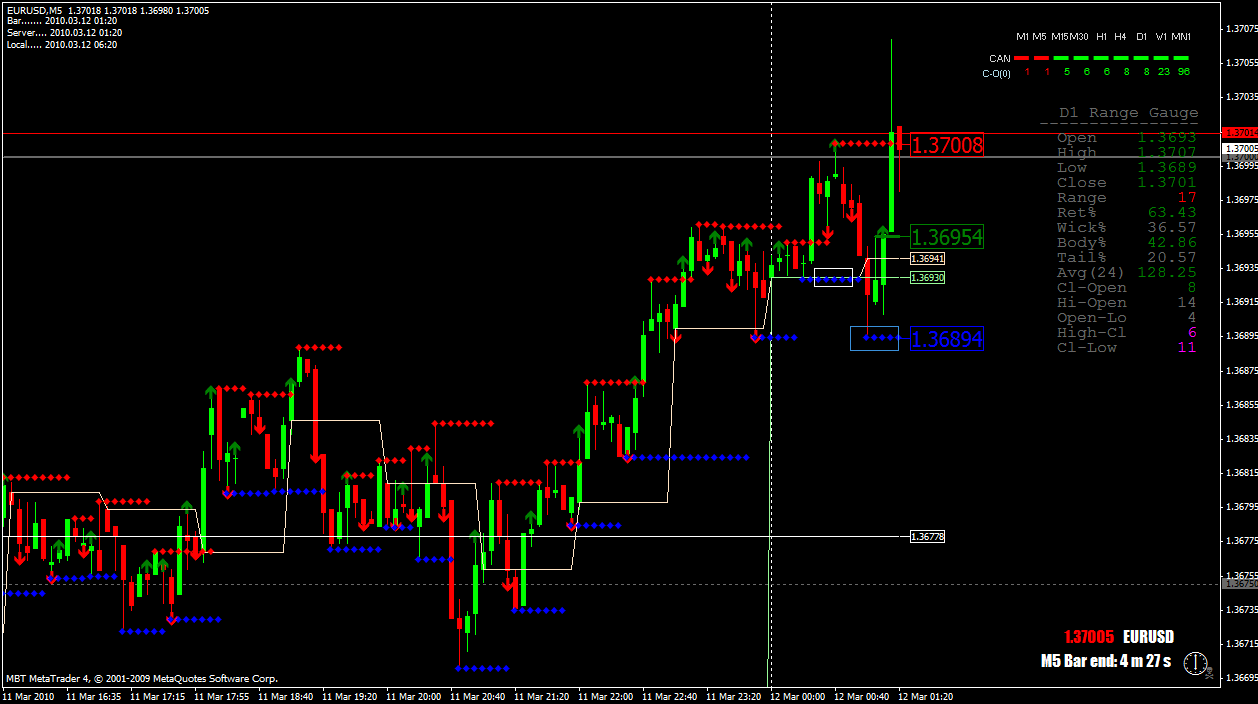
Pro Trader wrote:pp2 wrote:Pro Trader wrote:EU Long
W1 is up so only trade long
Price is within 20 pips of Daily Low
White rectangle shows previous support
Blue rectangle shows price breaking that support
Red candle close
Green candle close (above H1)
Long at high of green candle
Entry price is shown using TRO's Rat PLot indicator
Your recent charts are great Pro Trader.
Can I ask what you mean by 'Above/Below H1' in your musings?
Also, how many opportunities/pips you are getting using this method on a daily basis?
Thanks PP
pp2 TRO says the rule of thumb is to never trade against the H1 candle so I make sure that I always trade with H1 and also W1.
TRO_Opens indicator shows the H1 and W1 opening price, so for longs I make sure the DTB setup forms above both of those lines and for shorts I make sure the setup forms below both of the lines.
You don't need the TRO_Opens indicator though. The candle colour one in the top right shows you whether price is above or below H1 and W1. Still I like to see the lines aswell.
As for opportunities and pips it varies with me at the moment. This is only because my trading time is limited due to other commitments i.e. work/study etc. I usually get a few opportunities daily and I take whatever pips I can on each trade
Yes definately. When I look at the times I have lost in the past it has mostly been because of trading against the rules like H1 so now I wait for both to align.
I didn't understand how TRO took trades against H1 and W1 which win so often and when I tried it didn't work. Recently though I've been looking at higher tf's and when there's say a long setup on a 5m against H1 and W1 its sometimes at a support level on the H1 chart and the same for shorts. When a setup on a 5m occurs which is against H1 and W1 it is sometimes at a resistance level on the H1 chart or higher. I believe this is why TRO sometimes takes trades which are against H1 and W1, because there's confirmation on higher tf. If you only look at the 5m then you won't see them.
TRO please let me know if I'm on the right lines
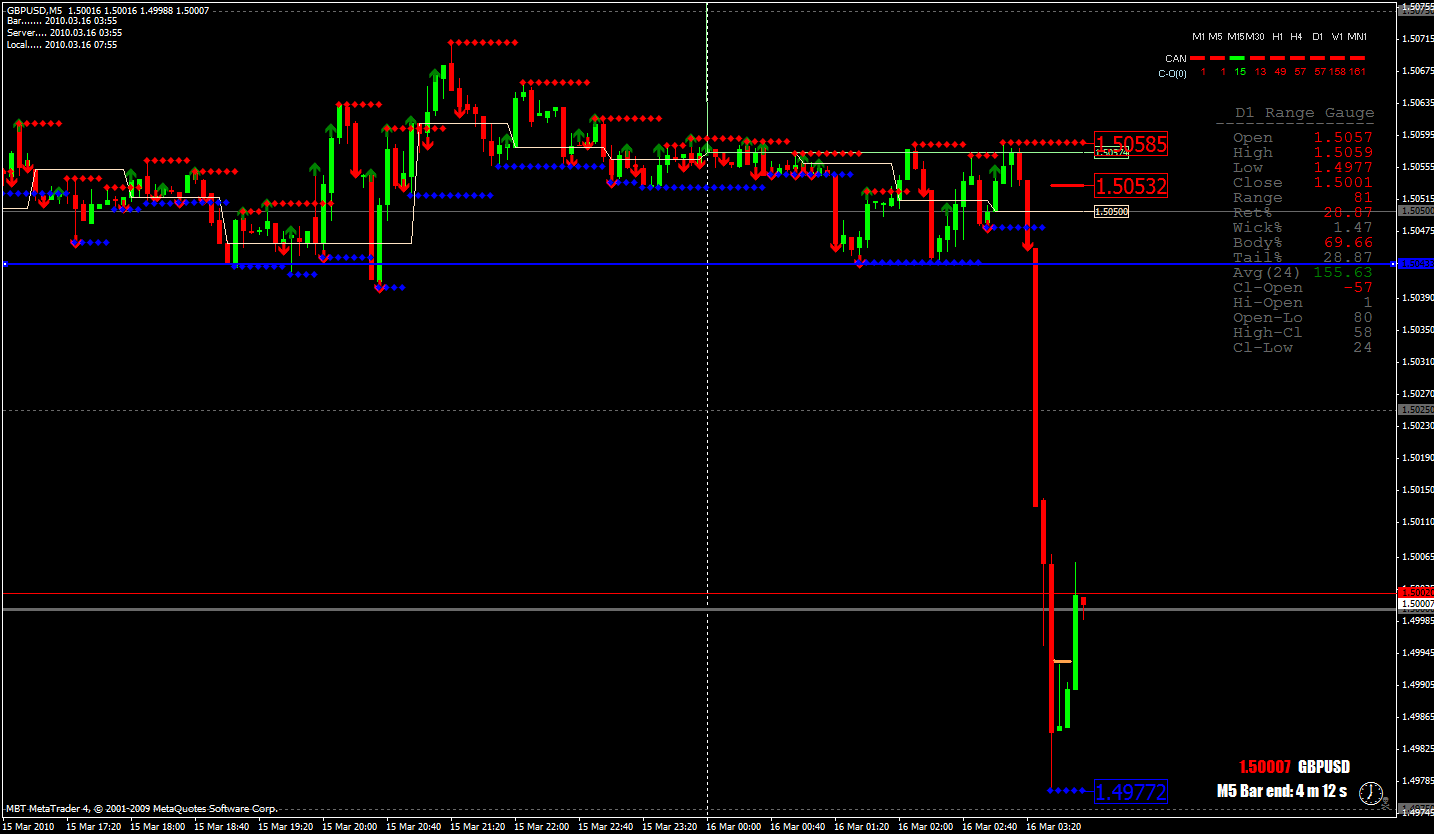
Further to my previous post, here's a trade I took this morning.
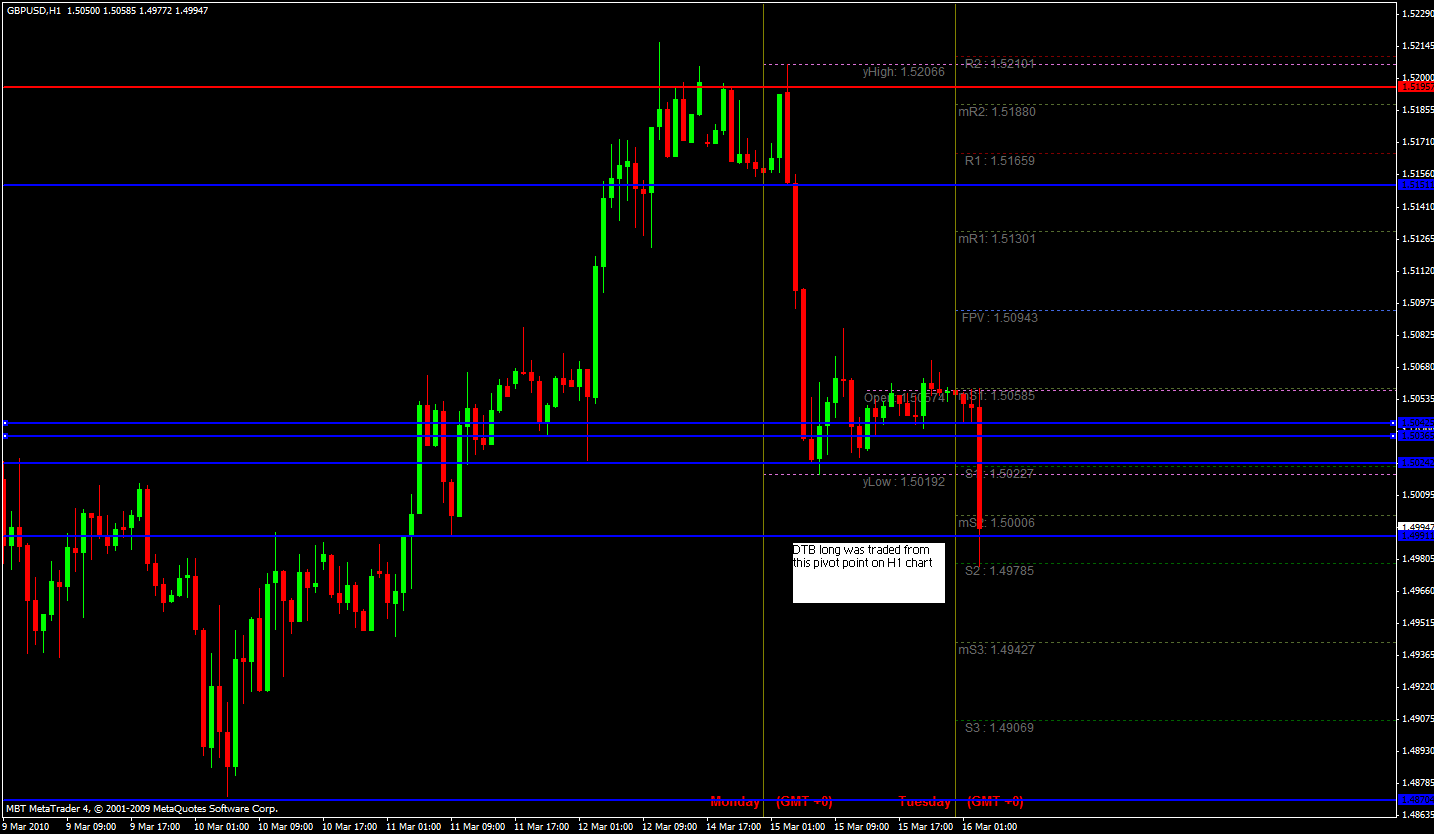
GU dropped a good 80 pips then reached a support level which I believe is a pivot point. I had an indicator on the H1 chart to show this. I could have had it on the 5m but with my other indis it looked to cluttered.
Even though it was against W1 and H1 the bounce off the pivot point was confirmation that it wasn't going lower. I took the long. The rat plot indi didn't show the price but I saw the level which I've indicated with a yellow line.
I actually took the intial short for the drop as it was moving off a resistance level as you can see from the H1 chart below but for some reason I clicked the wrong button and exited too early with only a few pips.
The red and blue lines are s/r levels I marked before I put the pivot indi on. First time I really drew s/r levels so I know it looks a bit messy.
Starting to see things more clearly now I feel.
Trading simply off a 5m with the rules in my previous posts (i.e. with H1 and W1 and at previous s/r levels) is profitable.
You can trade against H1 and W1 profitably if you have confirmation either from higher tf's of pivots etc.
TRO I know I mentioned trading in both directions (like a Yalie) but aside from that please let me know if Im on the right track