ProchargedMopar's Trading Trilogy

free & uncensored discussion arena for TheRumpledOne

Moderator: moderators

User avatar
prochargedmopar
rank: 10000+ posts
rank: 10000+ posts
Posts: 12045
Joined: Sat Dec 20, 2008 6:07 am
Reputation: 1790
Location: Granbury, TX
Gender: Male
Contact:

Postby prochargedmopar » Thu Oct 22, 2009 10:59 pm

do you see the huge up wick on the H1 chart on the left?

If you see that pattern at the bottom(inverted hammer)/top(hanging man) you are almost guaranteed a higher/lower close respectively on the next bar, either take a 2nd trade off the bottom or add to your original position.

Not another system/pattern!!!!!

Image
#1BODY in direction of profit #2INCREASE lot size Obsessively
My Losses cause me Great Laughter!
Trading Bible here> therumpledone/the-ideas-that-i-trade-by-t3256/page1670

Please add www.kreslik.com to your ad blocker white list.
Thank you for your support.

User avatar
prochargedmopar
rank: 10000+ posts
rank: 10000+ posts
Posts: 12045
Joined: Sat Dec 20, 2008 6:07 am
Reputation: 1790
Location: Granbury, TX
Gender: Male
Contact:

Postby prochargedmopar » Thu Oct 22, 2009 11:10 pm

Do you see the nasty little Brown line??

There is a saying...remember it.
No Drop/No Top.

If you have a lower high but the next low does not break the previous low/valley.........price is going up. It's not a double top. YET.

Not another pattern......my heads about to explode... LOL

Now, If I can just get someone else to exit my trades for me.....I enter/they exit and give my partner half the proceeds.

Didn't TRO say it's something about it being harder to change what you've already learned than it is to learn something new.........

May be time to be a RAT.

Image
#1BODY in direction of profit #2INCREASE lot size Obsessively
My Losses cause me Great Laughter!
Trading Bible here> therumpledone/the-ideas-that-i-trade-by-t3256/page1670

User avatar
prochargedmopar
rank: 10000+ posts
rank: 10000+ posts
Posts: 12045
Joined: Sat Dec 20, 2008 6:07 am
Reputation: 1790
Location: Granbury, TX
Gender: Male
Contact:

Postby prochargedmopar » Fri Oct 23, 2009 3:52 am

And here are a couple trades based on volume as decision to enter.

See the small spinning top with low volume(yellow) after the big red down bar.........signs of weakness.
Trigger short.

Both e/j and u/j looked the same......
See the profit......

Still skinning rats!!!

Image
#1BODY in direction of profit #2INCREASE lot size Obsessively
My Losses cause me Great Laughter!
Trading Bible here> therumpledone/the-ideas-that-i-trade-by-t3256/page1670

pip9999
rank: <50 posts
rank: <50 posts
Posts: 18
Joined: Wed Oct 21, 2009 12:18 am
Reputation: 0
Gender: Male

Postby pip9999 » Fri Oct 23, 2009 4:07 am

prochargedmopar wrote:And here are a couple trades based on volume as decision to enter.

See the small spinning top with low volume(yellow) after the big red down bar.........signs of weakness.
Trigger short.

===============
Hi Prochardedmopar,

- What is Tro indicator for "yellow bar" which was interpretred as "Signs of weakness" ?
- Is this pattern : small spinning tops with low volume(yellow) after big red(climax bar ?) reliabled to go Short (Red Rat Reverse)?

PS. I am looking VSA Uptrust pattern with Testing bar confirmation to confirm Short (Red Rat Reverse Method).

Thank you


Both e/j and u/j looked the same......
See the profit......

Still skinning rats!!!

Image

User avatar
lukx
rank: 500+ posts
rank: 500+ posts
Posts: 789
Joined: Wed Feb 04, 2009 5:10 pm
Reputation: 2
Gender: Male
Contact:

Postby lukx » Fri Oct 23, 2009 1:43 pm

MightyOne wrote:Just throwing this out in the open.

Image

If you enter on a 10 pip retracement with a 7 pip SL and an 11 pip target what is your draw down?

+77 less 14?
+66 less 21?

This is the system I used when trading live with a buddy from Jam.

If 10 pips is the retracement we are using then 15 pips is a real move.
If there is a small retracement on the chart of 15 pips then we have to ask for more than 10 pips.
Whatever we asked for was assumed to be 2/3 of a real move.
If we asked for 12 then 18 pips was a real move.

1. wait for a real move.
2. enter on a retracement
3. use a SL of half the largest of the small retracements.
4. target the smallest retracement size or multiples of the smallest.


Does anyone here understands, how MO is drawing those boxes and could explain it how to draw them?

Please add www.kreslik.com to your ad blocker white list.
Thank you for your support.

User avatar
prochargedmopar
rank: 10000+ posts
rank: 10000+ posts
Posts: 12045
Joined: Sat Dec 20, 2008 6:07 am
Reputation: 1790
Location: Granbury, TX
Gender: Male
Contact:

Postby prochargedmopar » Fri Oct 23, 2009 2:37 pm

pip9999 wrote:
prochargedmopar wrote:And here are a couple trades based on volume as decision to enter.

See the small spinning top with low volume(yellow) after the big red down bar.........signs of weakness.
Trigger short.

===============
Hi Prochardedmopar,

- What is Tro indicator for "yellow bar" which was interpretred as "Signs of weakness" ?
- Is this pattern : small spinning tops with low volume(yellow) after big red(climax bar ?) reliabled to go Short (Red Rat Reverse)?

PS. I am looking VSA Uptrust pattern with Testing bar confirmation to confirm Short (Red Rat Reverse Method).

Thank you


Both e/j and u/j looked the same......
See the profit......

Still skinning rats!!!

Image


pip9999,

Those are called chart bars.
You can do a search through the indicators on this thread to find them.
Also a good read......

http://www.forexfactory.com/showthread.php?t=157629
#1BODY in direction of profit #2INCREASE lot size Obsessively
My Losses cause me Great Laughter!
Trading Bible here> therumpledone/the-ideas-that-i-trade-by-t3256/page1670

User avatar
prochargedmopar
rank: 10000+ posts
rank: 10000+ posts
Posts: 12045
Joined: Sat Dec 20, 2008 6:07 am
Reputation: 1790
Location: Granbury, TX
Gender: Male
Contact:

Postby prochargedmopar » Fri Oct 23, 2009 2:54 pm

lukx wrote:
MightyOne wrote:Just throwing this out in the open.

Image

If you enter on a 10 pip retracement with a 7 pip SL and an 11 pip target what is your draw down?

+77 less 14?
+66 less 21?

This is the system I used when trading live with a buddy from Jam.

If 10 pips is the retracement we are using then 15 pips is a real move.
If there is a small retracement on the chart of 15 pips then we have to ask for more than 10 pips.
Whatever we asked for was assumed to be 2/3 of a real move.
If we asked for 12 then 18 pips was a real move.

1. wait for a real move.
2. enter on a retracement
3. use a SL of half the largest of the small retracements.
4. target the smallest retracement size or multiples of the smallest.


Does anyone here understands, how MO is drawing those boxes and could explain it how to draw them?


Funny, I was studying that picture last night at work, found it in my net book bag.
Been a while.

Basic price analysis is my take on boxes.
You could also just mark the Highs/Lows of each "wave" if that's how you see. Take note of the size of correction on each move. Boxes help some to keep things in order/compacted I suspect.

Read this thread, It's good.

http://www.elitetrader.com/vb/showthrea ... did=113456

I need to apply more of it when trading, I kinda get lost in the mix as I get too close to my work. LOL

Keep in mind, I'm not telling you to go trade tick charts, but if I had some good software that was free, I'd love too.
Throw on a good trend candle and go to town.
Last edited by prochargedmopar on Fri Oct 23, 2009 10:36 pm, edited 1 time in total.
#1BODY in direction of profit #2INCREASE lot size Obsessively
My Losses cause me Great Laughter!
Trading Bible here> therumpledone/the-ideas-that-i-trade-by-t3256/page1670

User avatar
prochargedmopar
rank: 10000+ posts
rank: 10000+ posts
Posts: 12045
Joined: Sat Dec 20, 2008 6:07 am
Reputation: 1790
Location: Granbury, TX
Gender: Male
Contact:

Postby prochargedmopar » Fri Oct 23, 2009 3:10 pm

Today London started bad..............!!!

Think I lost the first 5 out of six trades.
After taking all these demo trades, trading live was totally different. Weird.
Once I got in a groove though things started to click.
News came just as I was back to b/e.
Had some fun with that.
Traded G/U long for about 3 hrs. after the news came out. LOL
WHAT FUN!!!!!!

A couple over 8 trades for this wacky friday treat day.

GBP/USD 1 B 1.63579 1.63635 5.6 0.56 0.00 10/23/2009 10:20 10/23/2009 10:27
GBP/USD 1 B 1.63404 1.63565 16.1 1.61 0.00 10/23/2009 10:06 10/23/2009 10:19
GBP/USD 1 B 1.63564 1.63451 -11.3 -1.13 0.00 10/23/2009 10:00 10/23/2009 10:07
GBP/USD 9 B 1.63404 1.63451 4.7 4.23 0.00 10/23/2009 10:06 10/23/2009 10:07
GBP/USD 1 B 1.63637 1.63553 -8.4 -0.84 0.00 10/23/2009 09:40 10/23/2009 10:00
GBP/USD 10 B 1.63494 1.63553 5.9 5.90 0.00 10/23/2009 09:59 10/23/2009 10:00
GBP/USD 2 B 1.63651 1.63553 -9.8 -1.96 0.00 10/23/2009 09:50 10/23/2009 10:00
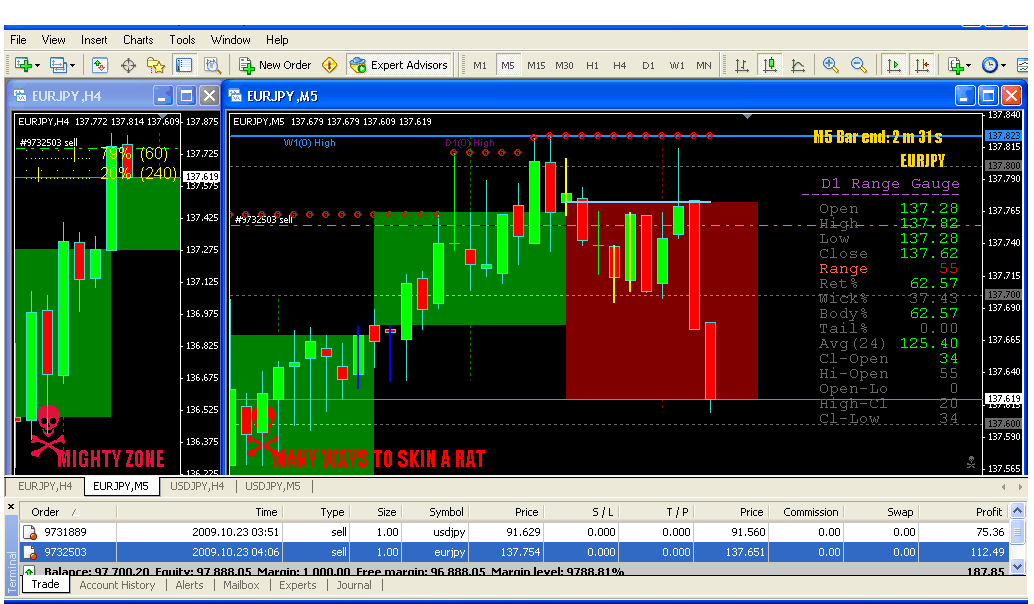
EUR/JPY 1 S 138.211 138.115 9.6 1.05 0.00 10/23/2009 08:51 10/23/2009 09:04
GBP/USD 1 B 1.64053 1.64099 4.6 0.46 0.00 10/23/2009 08:32 10/23/2009 08:34
GBP/USD 1 B 1.63796 1.64032 23.6 2.36 0.00 10/23/2009 08:26 10/23/2009 08:31
GBP/USD 1 B 1.63764 1.63773 0.9 0.09 0.00 10/23/2009 08:13 10/23/2009 08:25
GBP/USD 1 B 1.63764 1.63820 5.6 0.56 0.00 10/23/2009 08:13 10/23/2009 08:17
GBP/USD 1 B 1.64196 1.63842 -35.4 -3.54 0.00 10/23/2009 05:56 10/23/2009 08:15
GBP/USD 1 B 1.63867 1.63842 -2.5 -0.25 0.00 10/23/2009 07:22 10/23/2009 08:15
GBP/USD 8 B 1.63764 1.63842 7.8 6.24 0.00 10/23/2009 08:13 10/23/2009 08:15
GBP/USD 1 B 1.64310 1.64448 13.8 1.38 0.00 10/23/2009 05:25 10/23/2009 06:01
GBP/USD 1 B 1.66771 1.66784 1.3 0.13 0.00 10/23/2009 03:53 10/23/2009 03:54
GBP/USD 1 S 1.66905 1.66771 13.4 1.34 0.00 10/23/2009 03:47 10/23/2009 03:53
GBP/USD 2 S 1.66905 1.66853 5.2 1.04 0.00 10/23/2009 03:47 10/23/2009 03:49
GBP/USD 1 B 1.66355 1.66556 20.1 2.01 0.00 10/23/2009 02:56 10/23/2009 03:04
GBP/USD 1 B 1.66355 1.66497 14.2 1.42 0.00 10/23/2009 02:56 10/23/2009 03:03
GBP/USD 2 S 1.66529 1.66355 17.4 3.48 0.00 10/23/2009 02:49 10/23/2009 02:56
GBP/USD 18 S 1.66529 1.66349 18 32.40 0.00 10/23/2009 02:49 10/23/2009 02:53
GBP/USD 20 B 1.66567 1.66529 -3.8 -7.60 0.00 10/23/2009 02:47 10/23/2009 02:49
GBP/USD 20 S 1.66489 1.66572 -8.3 -16.60 0.00 10/23/2009 02:46 10/23/2009 02:47
GBP/USD 20 B 1.66450 1.66494 4.4 8.80 0.00 10/23/2009 02:40 10/23/2009 02:46
GBP/USD 3 S 1.66234 1.66423 -18.9 -5.67 0.00 10/23/2009 02:38 10/23/2009 02:40
GBP/USD 6 S 1.66236 1.66423 -18.7 -11.22 0.00 10/23/2009 02:34 10/23/2009 02:40
GBP/USD 3 B 1.66341 1.66236 -10.5 -3.15 0.00 10/23/2009 02:24 10/23/2009 02:34
GBP/USD 3 S 1.66241 1.66343 -10.2 -3.06 0.00 10/23/2009 02:22 10/23/2009 02:23
142 54.4 20.04 0.00

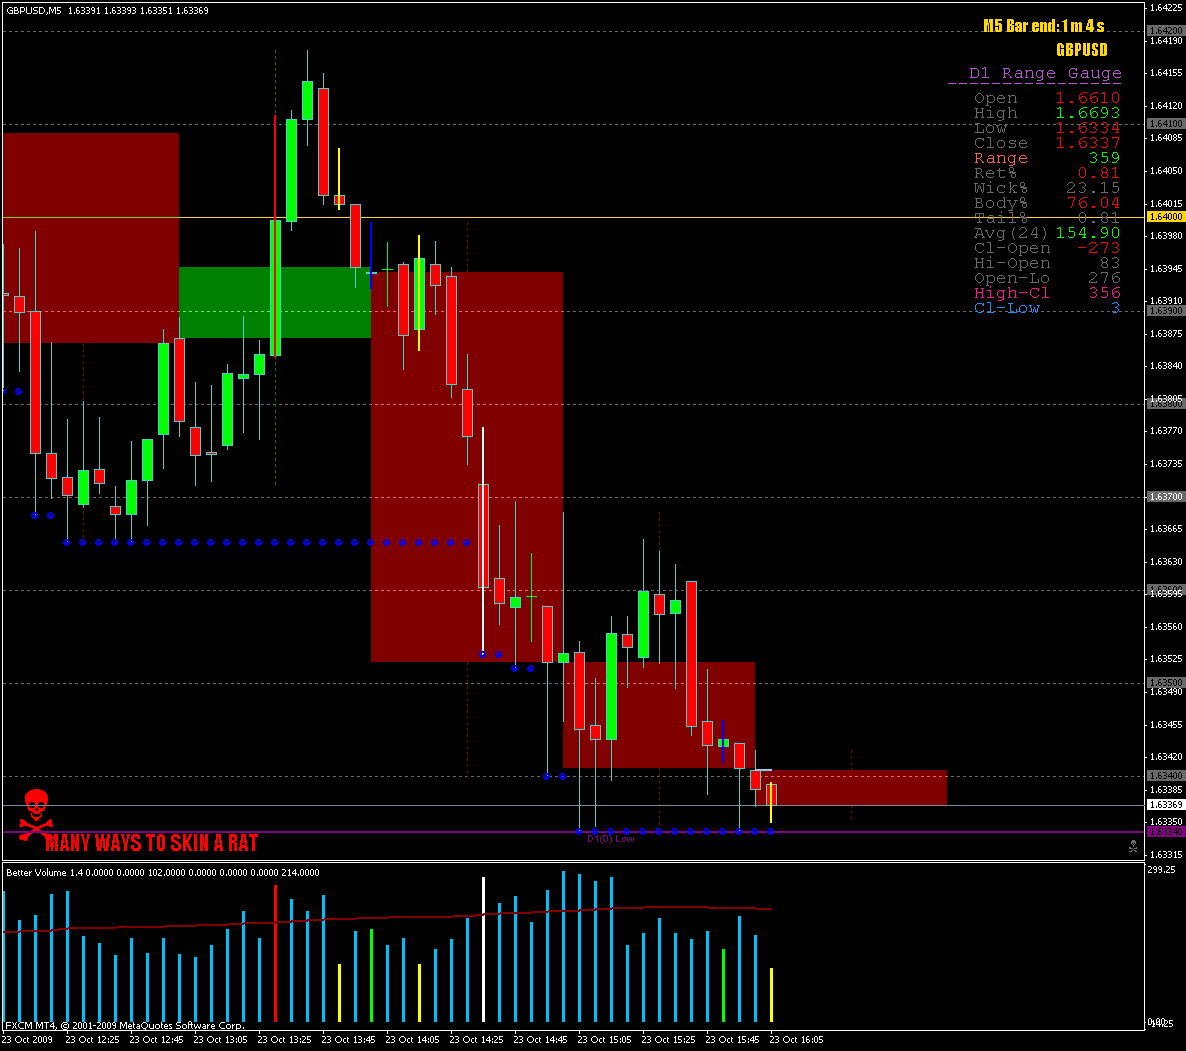
Here is my FINAL permutation of a trading chart for trading candles.

Basics.
fib dots set to 102 on m5.
Daily/weekly high lows plotted
Range guage
volume/chart bars
Sweetspots
Bar end timers/b-clock
I've got D1/H4 on left
H1/M5 on right

Candles/volume/Range.

What more could a guy ask for?

Image

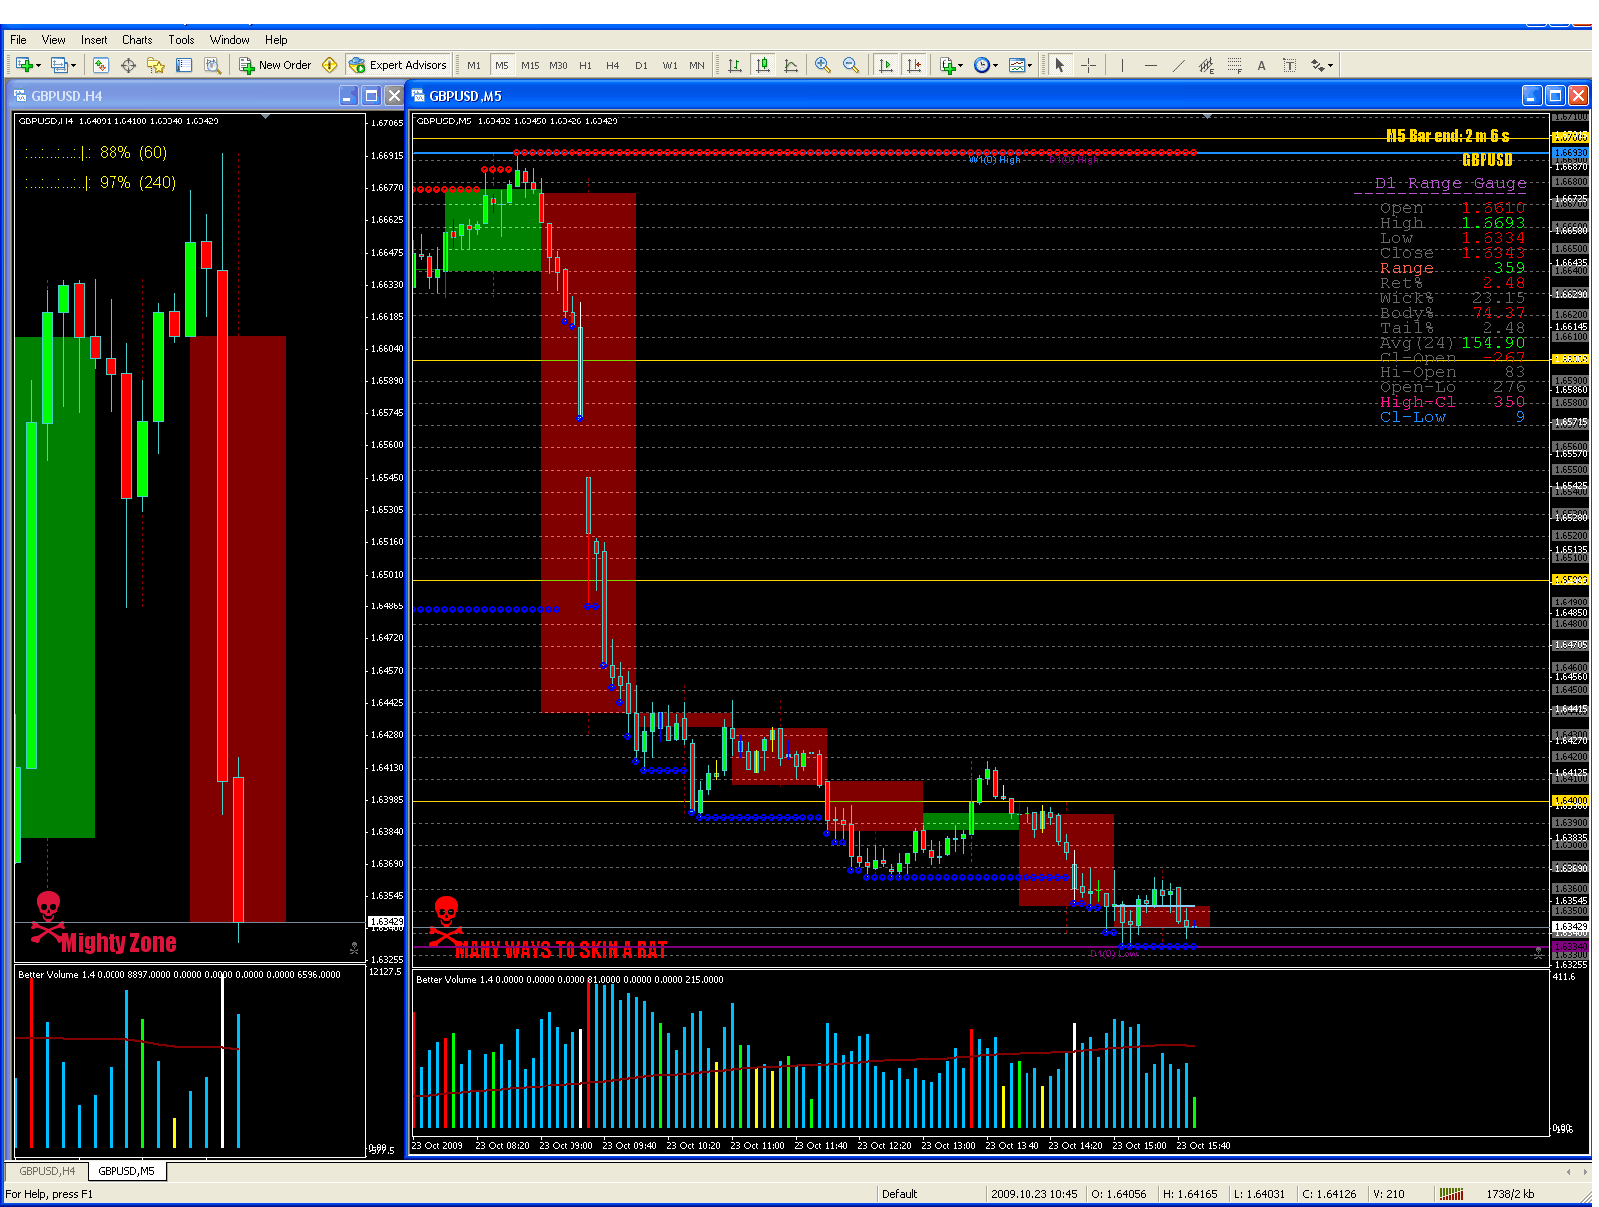
I like to zoom in a little.
About time for the Green rats to get fat eh?
Avg range 150 today 350.......
Don't jump the gun, they can hold it down longer than you think.

Image
#1BODY in direction of profit #2INCREASE lot size Obsessively
My Losses cause me Great Laughter!
Trading Bible here> therumpledone/the-ideas-that-i-trade-by-t3256/page1670

User avatar
prochargedmopar
rank: 10000+ posts
rank: 10000+ posts
Posts: 12045
Joined: Sat Dec 20, 2008 6:07 am
Reputation: 1790
Location: Granbury, TX
Gender: Male
Contact:

Postby prochargedmopar » Sat Oct 24, 2009 8:22 am

For traders having difficulty, this is a very simple but informative video.

http://transcripts.fxstreet.com/2009/10 ... lysis.html

Trading back to a "drop/base/rally would be just like zeroing out traders.
He is telling to trade away from the supply/demand levels which both appear to be viable trading strategies.

Trading with the trend would be trading a rally/base/rally...corrections with trend heading to a higher time frame supply/demand zone.

Anyway, thought it might help someone.

Edit:
You might want to watch this vid first, what's real/what's not support and resistance.
Why momo works and you should also be able to deduct why it doesn't "work" in some circumstances.............

http://transcripts.fxstreet.com/2008/11 ... -is-r.html
#1BODY in direction of profit #2INCREASE lot size Obsessively
My Losses cause me Great Laughter!
Trading Bible here> therumpledone/the-ideas-that-i-trade-by-t3256/page1670

User avatar
prochargedmopar
rank: 10000+ posts
rank: 10000+ posts
Posts: 12045
Joined: Sat Dec 20, 2008 6:07 am
Reputation: 1790
Location: Granbury, TX
Gender: Male
Contact:

Postby prochargedmopar » Sat Oct 24, 2009 11:55 am

AFTER WATCHING THOSE VIDEOS..........LOOK AT G/U DAILY CHART AND TELL ME HONESTLY THAT YOU WOULD NOT HAVE EXPECTED PRICE TO DROP LIKE KING KONG FROM THE TOP OF THE EMPIRE STATE BUILDING........HONESTLY.

WHERE IS YOUR TARGET NOW????

Those poor little green rats that kept buying at the daily lows.....wait, that was me, I should have stayed a red rat and kept on turning right........silly me.

I did fairly well percentage wise during the week even though I was selling as price was moving up........I would have got fat on Friday.
11.5% increase as a green rat friday, Imagine what the red rats got.
#1BODY in direction of profit #2INCREASE lot size Obsessively
My Losses cause me Great Laughter!
Trading Bible here> therumpledone/the-ideas-that-i-trade-by-t3256/page1670

Please add www.kreslik.com to your ad blocker white list.
Thank you for your support.


Return to “TheRumpledOne”