Moderator: moderators


lukx wrote:as you can see after those pivots I woud looose money anyway
or simply I see wrong pivots:
aliassmith wrote:lukx wrote:as you can see after those pivots I woud looose money anyway
or simply I see wrong pivots:
From your previous posts I was about to put you on ignore.
I can see that you are just lashing out because you are frustrated.
First of all this trading style is a skill not a mechanical system.
You have to learn to see it first, then when you can see it, you have
to learn how to execute it.
Depending on how you decide to implement zerolines in your trading
it can take many hours of analysis and screen time and it isn't for
everyone.
With that said, I can see that you almost see it. DRagon was good
enough to mark your chart with the right viewpoint.
It is just like your chart points out.
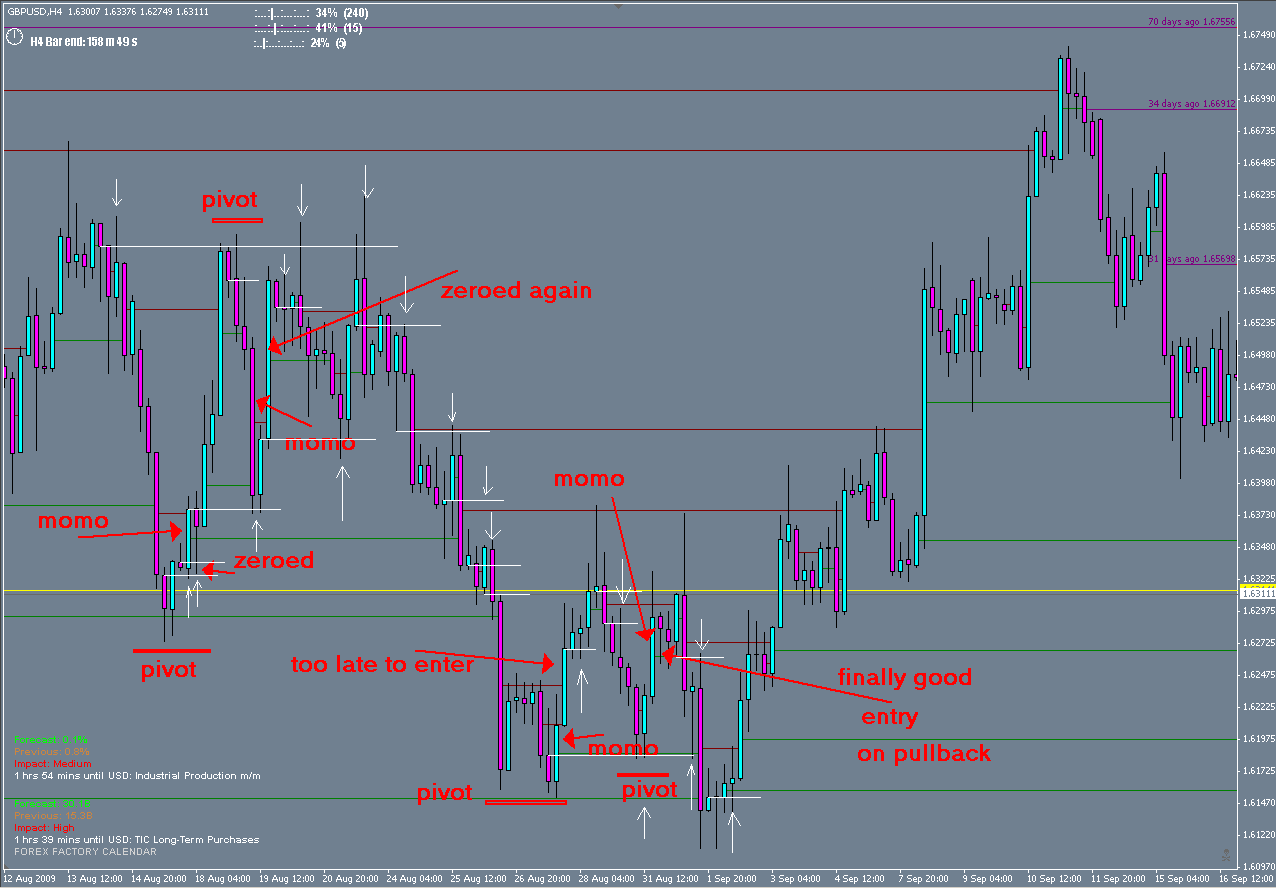
#1 there is a pivot
#2 there is a quiet period (small body)
#3 there is momo (2x body)
#4 price comes back and wicks the zeroline (your limit order)
#5 if your entry candle didn't close in profit get out
#6 if a candle closes against you then get out
#7 if price gets to the next closest ZL in profit get out

lukx wrote:my huge kudos to all guys who still helping me understand and didn't put me on ignoreYEP alias you're totally right all my poor posts came from my frustration.
Is this picture right better:
alias by #7 if price gets to the next closest ZL in profit get out you meant some zl back in time right? like the ones I marked here:

MightyOne wrote: I like to answer posts, but please don't ask me $#!+ like:
"Every candle is green and bullish momentum is getting out of control...when do I go short?"
Here is the triangle trade from not too long ago: