

pierre23 wrote:dragon33 wrote:pablo101 wrote:If I remember correctly MO doesn't move SL and holds for the big 100 odd pip moves when he mentions using average range x 2.5 in a trade, which is cool but I've never could stomach holding for + century pips. Still need more learning but still happy at present moment getting consistent pips
If you start from H4 and make your marks on H1 and M5 for finetuning it is possible to make 150 pips out of a run of 110 pips. Nobody is telling you you should stay in. What is teached here is to take profit when there is and reentry when you can. The zerolines show you the way.
On this picture the H4 zone tells you that price possibly will turn. What are the first things you should think of to catch a part of the momo. Will i take the BO and what will i target?
On the above picture you can see the BO and reverse lines drawed on the H1. This is for every tmf the same! Do you see how many opportunities there are to enter. You can always target near the H1 zones and watch how price is reacting.
Sorry to zoom out like that but i have the same run on the screen as on the H1. Only you can see the marks with the numbers. This is how it works. If you can not find a setup there isn't one that fits you. Stay out and wait for the right one
Hey mate, which indicator are you using which plots the mz? Could you please post the indicator? Helps with the visuals.
cheers
Never Lose Again
Moderator: moderators
- Attachments
-
 Blubbb_MightyZones.ex4
- (14.01 KiB) Downloaded 369 times
-
- Blubbb_MightyZones.mq4
- (8.37 KiB) Downloaded 425 times
Trading is like cycling, first you need to learn how.
Two options: you either lose or win!
Two options: you either lose or win!
Please add www.kreslik.com to your ad blocker white list.
Thank you for your support.
Thank you for your support.
-
Fxtraveller
- rank: 150+ posts

- Posts: 395
- Joined: Thu Nov 27, 2008 2:56 pm
- Reputation: 6
- Location: UK
- Gender:

Well. Bad start with Live on Zlines.
Very good EURJPY, D1 already too big, time for retracement, it entered my MZ zone, it retraced, TP was 20 pips, got out impatiently at +10 pips
price went later on and took my TP target.
Very good EURJPY, D1 already too big, time for retracement, it entered my MZ zone, it retraced, TP was 20 pips, got out impatiently at +10 pips
price went later on and took my TP target.
- Attachments
-
- eurjpy d1 hesitation.gif (13.2 KiB) Viewed 4947 times
-
- ej h1 tp.gif (12.32 KiB) Viewed 4947 times
-
Fxtraveller
- rank: 150+ posts
- Posts: 395
- Joined: Thu Nov 27, 2008 2:56 pm
- Reputation: 6
- Location: UK
- Gender:
Ok, the bad news now:
GBPUSD
Saw Zlines, entered SELL, Loss.
What happened there? I guess I did not wait for it to be wicked and see a body in the direction of profit in a single timeframe.
Just blindly entered.
Then reentered SELL with a wicked Zline, but still.
Cut my wins short, let my losses take a full stop.
comments from espip, dragon and others appreciated.
- Attachments
-
- gu for jmr h4.gif (11.24 KiB) Viewed 4939 times
-
- gu loss.gif (10.4 KiB) Viewed 4939 times
-
- gu for jmr.gif (10.18 KiB) Viewed 4939 times


Fxtraveller wrote:Ok, the bad news now:
GBPUSD
Saw Zlines, entered SELL, Loss.
What happened there? I guess I did not wait for it to be wicked and see a body in the direction of profit in a single timeframe.
Just blindly entered.
Then reentered SELL with a wicked Zline, but still.
Cut my wins short, let my losses take a full stop.
comments from espip, dragon and others appreciated.
for me
just due to the area we were coming out of on the daily and h4---- which looked like a stop run, especially how the h4 bar formed i would not be thrilled in looking short there
and
i am a lot less likely to just lob orders out if we are not looking at consecutive bars on the PA
edit---- the h4 was on consecutive bars--- if 1 wanted to try something there i would be out asap if things were not going my way due to the way the h4 bar formed.
i was looking long off the bottom due to the stop run--
missed most of this, got in a coupe scalps nothing impressive though
Bend over and assume the position for another 4 years of hope and change.
-
prochargedmopar

- rank: 10000+ posts

- Posts: 12073
- Joined: Sat Dec 20, 2008 6:07 am
- Reputation: 1790
- Location: Granbury, TX
- Gender:
- Contact:
You've got to be kidding me.
Somebody has been zeroed out, and somebody is banking because of it.
Look at purple line, It's a DAILY chart.
Hmmmmmm
Somebody has been zeroed out, and somebody is banking because of it.
Look at purple line, It's a DAILY chart.
Hmmmmmm
#1BODY in direction of profit #2INCREASE lot size Obsessively
My Losses cause me Great Laughter!
Trading Bible here> therumpledone/the-ideas-that-i-trade-by-t3256/page1670
My Losses cause me Great Laughter!
Trading Bible here> therumpledone/the-ideas-that-i-trade-by-t3256/page1670
Please add www.kreslik.com to your ad blocker white list.
Thank you for your support.
Thank you for your support.
-
prochargedmopar
- rank: 10000+ posts
- Posts: 12073
- Joined: Sat Dec 20, 2008 6:07 am
- Reputation: 1790
- Location: Granbury, TX
- Gender:
- Contact:
EXPANSION BODIES,
Or what "hiddengap" calls EB7"s look very similar to MOMO to me.
Here is the link and there are plenty more earlier in the thread.
http://www.forexfactory.com/showthread. ... 9&page=249
Or what "hiddengap" calls EB7"s look very similar to MOMO to me.
Here is the link and there are plenty more earlier in the thread.
http://www.forexfactory.com/showthread. ... 9&page=249
#1BODY in direction of profit #2INCREASE lot size Obsessively
My Losses cause me Great Laughter!
Trading Bible here> therumpledone/the-ideas-that-i-trade-by-t3256/page1670
My Losses cause me Great Laughter!
Trading Bible here> therumpledone/the-ideas-that-i-trade-by-t3256/page1670
-
thehumbledone
- rank: <50 posts

- Posts: 2
- Joined: Tue Sep 22, 2009 6:10 pm
- Reputation: 0
- Gender:

Questions
Hi...
My trading partner and I am lurking for about a month now, reading every post and looking at charts in this great forum. We have been trading for over 8 years and we are really interested in what you are doing here...it would be nice to be "FREE" as someone mentioned in a post.
But we must be honest with you great traders...we are having a very hard time understanding what you are looking for to identify a potential trade and what you use to determine your entries.
We dont understand some of the terms that many use here that seem to be important to their success:
 Z Lines--can someone be so kind and show us on a chart where and what a Z line is?
MOMO candle and...what is a momo candle? I read somewhere that its not just a candle that is 2x's as large as a prior candle...so what things make up a MOMO candle?
HELD PROFITS--what is meant by this exactly? How do i know there are held profits and what is the psychological importance to trading about held profits?
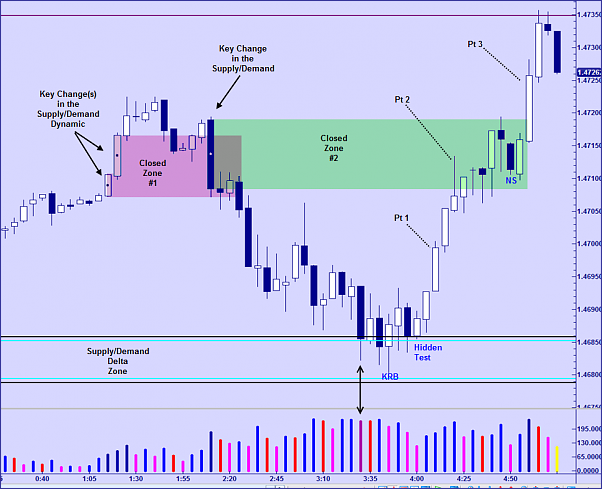
Lastly we looked at Dragons chart and have some questions about why lines are drawn where they are and also why? We have attached the marked up chart.
Hopefully this isnt too much of a pain and someone will be gracious and kind enough to help us so that we can in turn help others as they come onto this great forum.
Thanks for all that everyone does here!
Humbled
My trading partner and I am lurking for about a month now, reading every post and looking at charts in this great forum. We have been trading for over 8 years and we are really interested in what you are doing here...it would be nice to be "FREE" as someone mentioned in a post.
But we must be honest with you great traders...we are having a very hard time understanding what you are looking for to identify a potential trade and what you use to determine your entries.
We dont understand some of the terms that many use here that seem to be important to their success:
Lastly we looked at Dragons chart and have some questions about why lines are drawn where they are and also why? We have attached the marked up chart.
Hopefully this isnt too much of a pain and someone will be gracious and kind enough to help us so that we can in turn help others as they come onto this great forum.
Thanks for all that everyone does here!
Humbled
- Attachments
-
- GU H1.gif (34.77 KiB) Viewed 4638 times
Re: Questions
thehumbledone wrote:Hi...
My trading partner and I am lurking for about a month now, reading every post and looking at charts in this great forum. We have been trading for over 8 years and we are really interested in what you are doing here...it would be nice to be "FREE" as someone mentioned in a post.
But we must be honest with you great traders...we are having a very hard time understanding what you are looking for to identify a potential trade and what you use to determine your entries.
We dont understand some of the terms that many use here that seem to be important to their success:
Lastly we looked at Dragons chart and have some questions about why lines are drawn where they are and also why? We have attached the marked up chart.
Hopefully this isnt too much of a pain and someone will be gracious and kind enough to help us so that we can in turn help others as they come onto this great forum.
Thanks for all that everyone does here!
Humbled
i am honestly not sure if this is a serious post or not
if it is
and i am sure i am going to sound like an ass
but
have you read the thread?
Bend over and assume the position for another 4 years of hope and change.
Heh...
Hey ES/PIP,
Would you mind taking a look at my chart from the previous page and let me know your thoughts? Just interested in what you think and any suggestions you may have.
Thanks for your time!
James
Would you mind taking a look at my chart from the previous page and let me know your thoughts? Just interested in what you think and any suggestions you may have.
Thanks for your time!
James

Hello traders.
I am currently at around page 250 in this thread and I am a tiny bit stumped when it comes to trading the Zero Line.
I re-read this thread even twice from around page 130 where MO started posting and I am still confused about the "Analogy of the Zero Line".
I attached two photos.
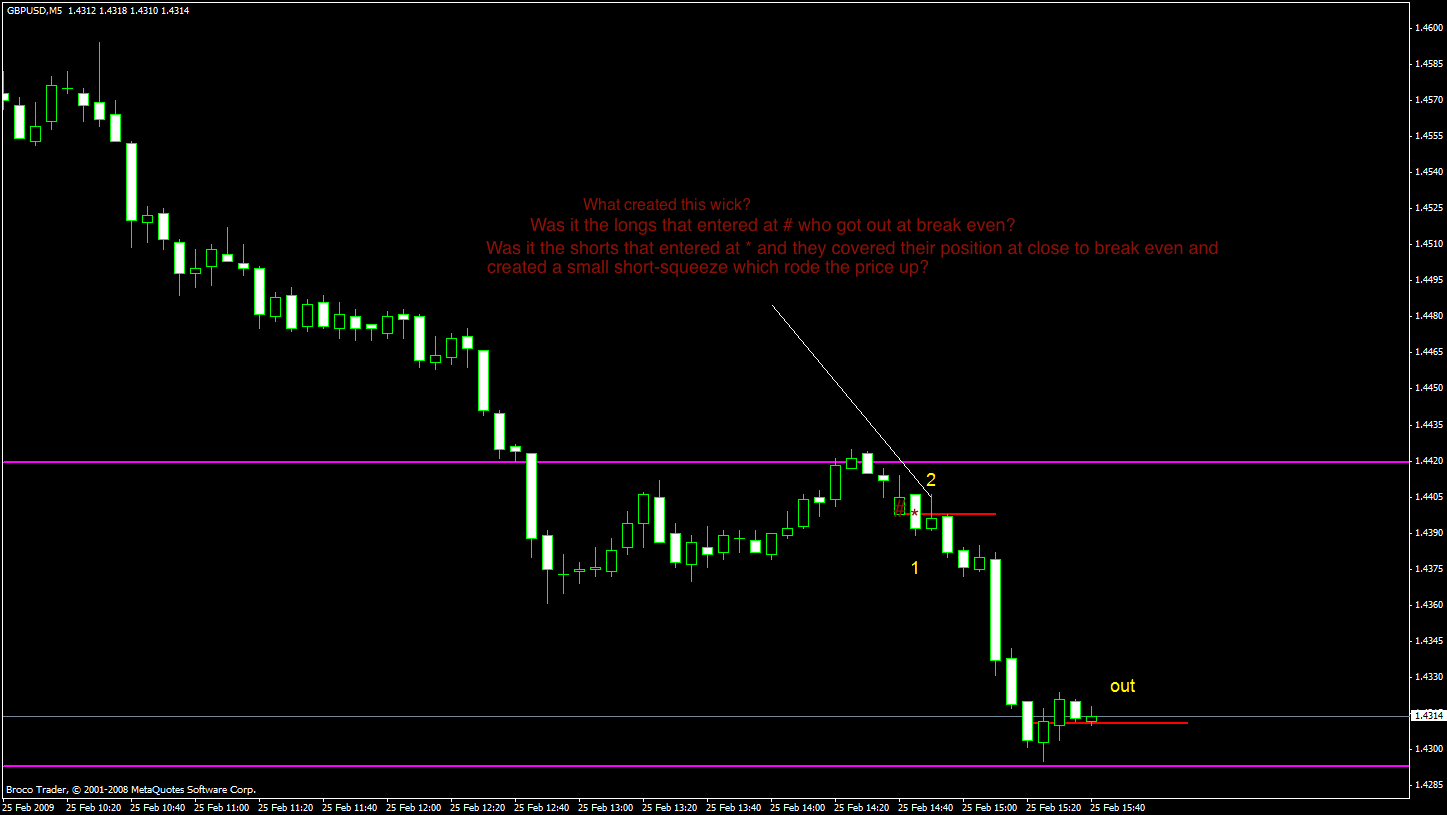
Looking at the first photo. Why did a spike up past the ZL form?
Was it because of the shorts that entered at * who thought the price was going to go down but where wrong when it stalled so they tried getting out at break even and created a short squeeze which temporary drove the price up?
Or was it the long who thought that their long entry at # was not going to work out and tried to get out at break even?
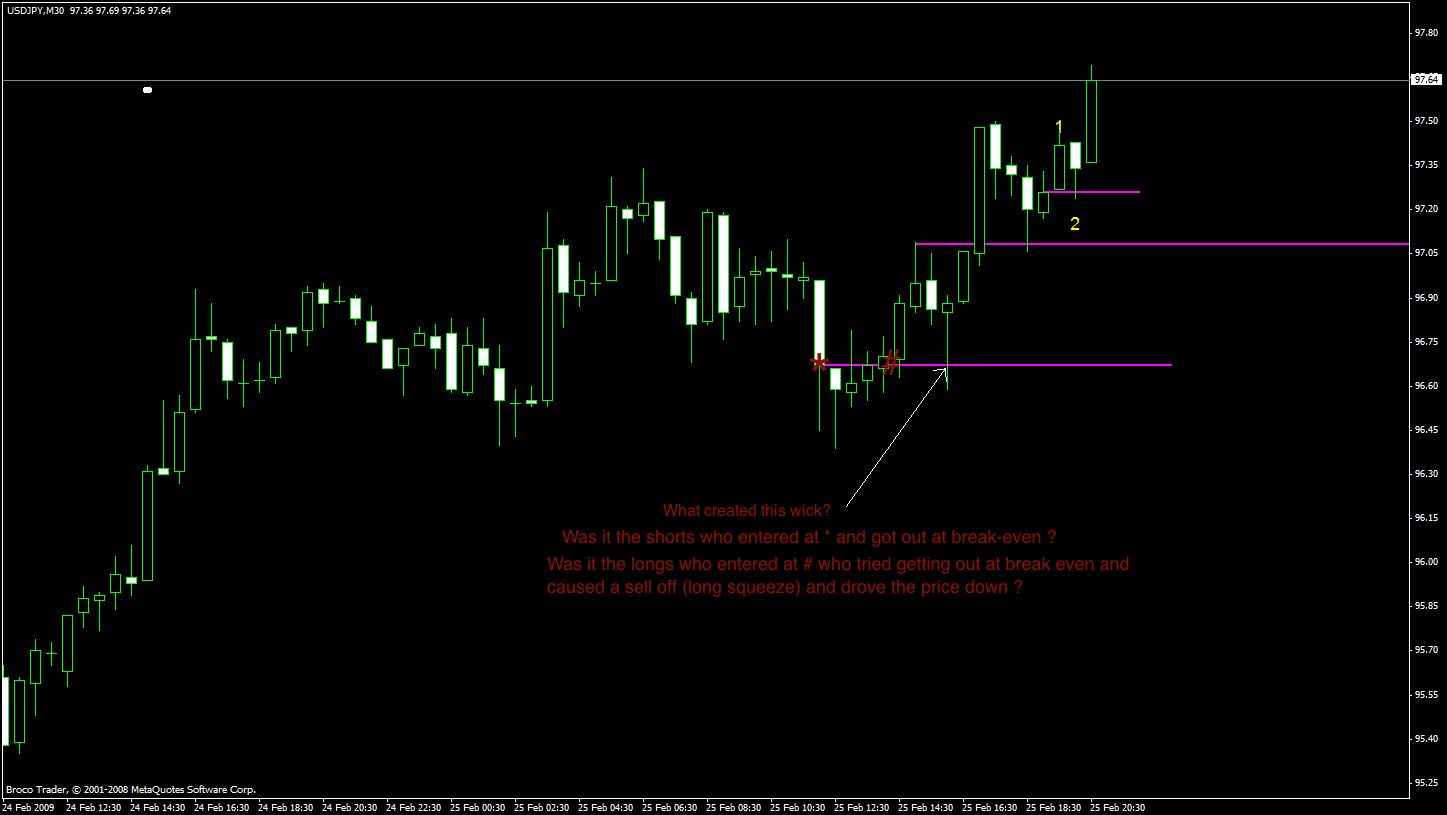
In the second photo a spike down happens.
Now did this spike down happen because the longs that entered at # were getting nervous with their position and they tried getting out a break even and created a sell off (long squeeze).
Or was it the shorts who entered at * were nervous when their short position went against them and they waited to get out at break even?
I am currently at around page 250 in this thread and I am a tiny bit stumped when it comes to trading the Zero Line.
I re-read this thread even twice from around page 130 where MO started posting and I am still confused about the "Analogy of the Zero Line".
I attached two photos.
Looking at the first photo. Why did a spike up past the ZL form?
Was it because of the shorts that entered at * who thought the price was going to go down but where wrong when it stalled so they tried getting out at break even and created a short squeeze which temporary drove the price up?
Or was it the long who thought that their long entry at # was not going to work out and tried to get out at break even?
In the second photo a spike down happens.
Now did this spike down happen because the longs that entered at # were getting nervous with their position and they tried getting out a break even and created a sell off (long squeeze).
Or was it the shorts who entered at * were nervous when their short position went against them and they waited to get out at break even?
Please add www.kreslik.com to your ad blocker white list.
Thank you for your support.
Thank you for your support.