Patch
I take no credit for Momo - that is Mighty One. I see the edge in it, but don't get hung up if you don't. A simple MA cross can do the trick as well - despite what some may say.
in regards to math lines - Just unzip and read the attachment - more of an explanation than a system per se
more here
http://codebase.mql4.com/4868
http://www.google.com/search?hl=en&rlz= ... ell=1&aq=t
Remember this is a game of aggregated statistics - one or two trades means nothing, much like a few hands of black jack mean nothing if you are counting cards or running the casino. You should learn to love the law of large numbers almost as much as you love your family (maybe more in my case, but that is between myself and my therapists). You will realize what mightyone means when he says more risk is just more risk, but more profit is more profit.
I could probably tell you everything I have learned in the past year, much like mightyone has been dumping his brain, but until you see for yourself how you can make a fortune losing up to 85% of the time, and how you can risk 10 to 15 pips to make 100 pips plus, it will not register with you - it didn't register with me, but i could be super stupid.
If you figure out how to regularly kill a trade when a candle closes against you and not have it keep going in the way you thought it was going to go, the battle is almost half won. If you rejig your concept of what you consider a loss to be, you will be closer still (here is a hint, a loss doesn't always need to be negative).............
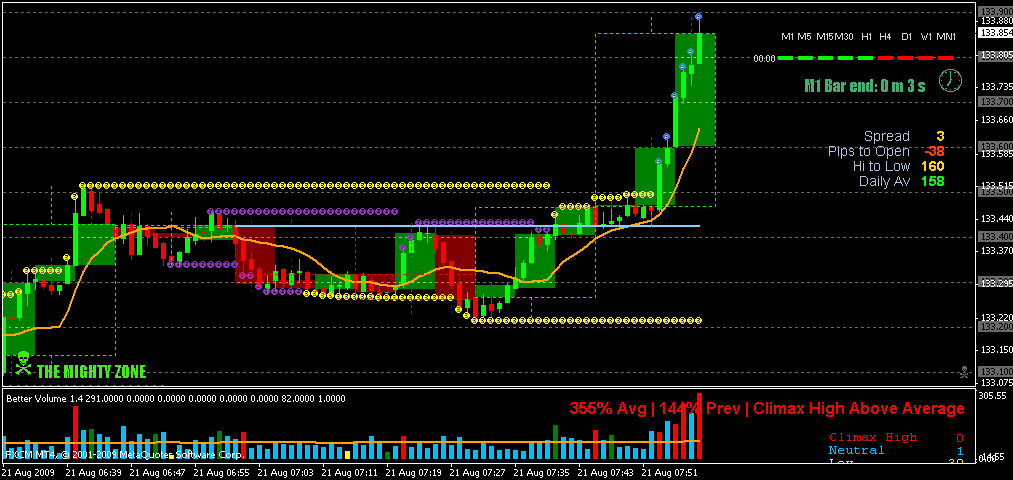
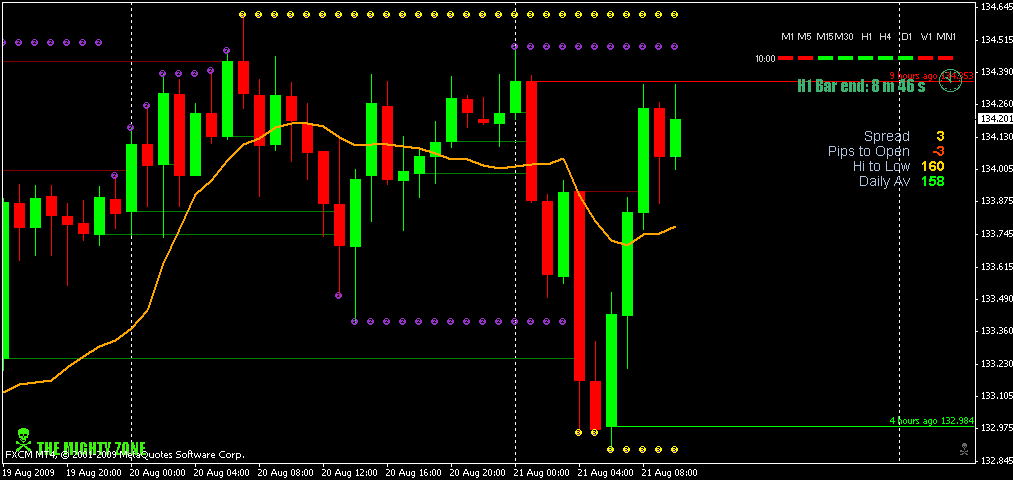
Remember, a pair moves thru both price and time............and pay particular attention to the daily range relative to the open of the 3 major markets
Having said all that, crack open a spread sheet and start recording price behavior when momo comes into the market and crunch some RR numbers. It doesn't need to be exact........i promise you that
I don't know where you are in your trading, so this could all be redundant and i could be the fool...........
Patch wrote:razorboy
How do I know when momo comes into the market? What time frames am I looking at?
I've cut and pasted all of MO's posts for about 100 pages and reading them, then will do the same with the next 100. Right now I look at you all's 101 charts and I don't see much, and don't hear what the red and green bars are whispering to me.
Could you post a chart of the Murray Math line on a EJ chart? What kind of line does this make anyway?
Patch
In VA