
In relation to all that, may i suggest to look at:
Harmonic trading ( that Zl story make me think ALOT of Gartley pattern/ab=cd) and
VSA trading ( volume can help alot to spot momentum and post momentum move...
I'm also looking at Ralph Vince work on Money mangement based on the kelly formula... Optimal F and Math epexctation.
Worth a look i think.
Thx for mister Ross reference!
Food for tough....
Never Lose Again
Moderator: moderators
Please add www.kreslik.com to your ad blocker white list.
Thank you for your support.
Thank you for your support.


The first 10 years of live trading are the most trying
After 2 years you think you know what you are doing
After 4 years you begin to know what you are doing
After 8 years you laugh at what you were doing
I can't wait for my 16th year
After 2 years you think you know what you are doing
After 4 years you begin to know what you are doing
After 8 years you laugh at what you were doing
I can't wait for my 16th year
maciekkov wrote:TheRumpledOne wrote:Why can't we see what price is doing?
Price is either moving up, moving down or not moving at all.
What is wrong with our eyes that we can't see what price is doing?
It's so simple, price is either moving or standing still.
Why do we need colors to know which way price is moving?
Does adding a line really make it easier to see what price is doing?
Well, if adding one line makes it easier then adding more lines should make it even easier, right?
Why can't our eyes see the "trend"?
Maybe adding another chart will help us see...
Naturally, if adding another chart makes it easier, we should add more.
If only someone would tell us the "magic" numbers to use...
Price either climbs up or down a "stair".
You mean to tell me I can think of price going up and down stairs?
IT CAN'T BE THAT SIMPLE!!
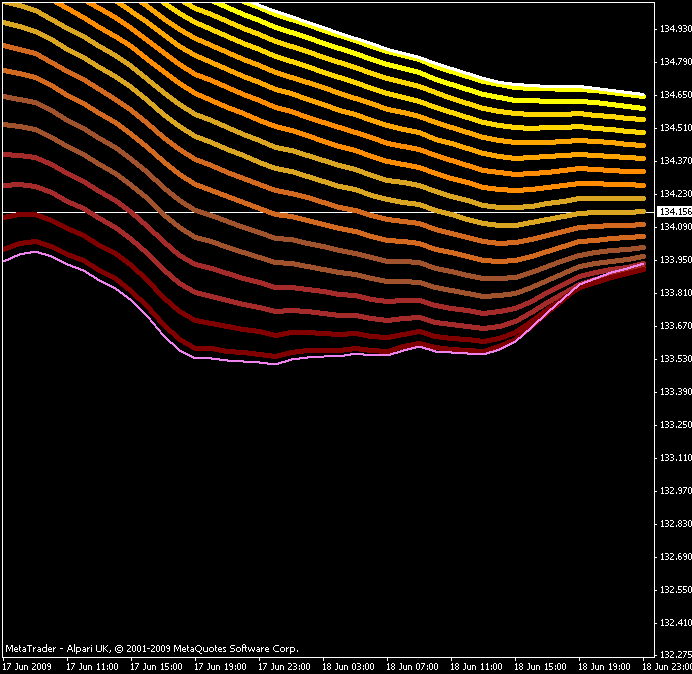
Tro but how we can know how many steps have this stairs?i see how price move up or down i see wicks candle its mean false move and this is losers we should playing on body candel then we will be in profit,but i dont see what price is doing ,if you see that why you dont tell this for us .you made so many indactors why??if it is so simple we dont need any idactors just tell what price is doing,price bounced between lines 00 25 75 i now that because i see that but when i read your post COULD YOU SEE THAT or open your eye i dont get it.i know all indactors like OS MACD MA and more they are lagging i dont use that i use only this horizontal lines because price move between horizontal lines but somtimes price cross 3 lines that was 75 pips and i dont know when price will be doing so big move i should hold but i close when i have 25 pips or smaller.i still try realy but i cant see where price move now i still thinking i have only lucky in this trade:(
-
aVi

- rank: 50+ posts

- Posts: 84
- Joined: Tue Mar 24, 2009 4:30 am
- Reputation: 0
- Location: The Island w/ Kate
- Gender:

PTG wrote:All you need is the desire to make beautiful things happen on canvas.
Welcome to the joy of painting

Download Bob Ross paintings - erm - sorry, got that mixed up
Download Joe Ross material here: CLICK CLICK CLICK
You're too kind.
Wake up Mr. Green...
-
monolisa

- rank: 150+ posts

- Posts: 351
- Joined: Fri Jun 12, 2009 11:38 am
- Reputation: 0
- Location: All Quiet on the Western Front
- Gender:

Hi MO,
So if we trade the event, then we could enter a position when there's a breakout (momentum) and exit/re-enter based on the price action (correction/real move) of higher TF chart? Also, what do you mean by "long term position"?
On the other hand, if we trade like you (postmomentum trader) then we can enter either at the beginning of the correction or the real move, or both. In a nut shell, movement/momo gives you the signal, and using support and resistance (defined by the mighty zone and highest high/lowest low of the momentum) you are able to identiy the correction and the real move (both are retracements).
Thanks.
Lis
"Know your enemy and know yourself, find naught in fear for 100 battles. Know yourself but not your enemy, find level of loss and victory. Know neither your enemy or yourself, wallow in defeat every time." - Sun Tzu
Food for thought
Found in one of the oanda forums:
http://www2.oanda.com/cgi-bin/msgboard/ultimatebb.cgi?ubb=get_topic;f=17;t=004620;p=2#000029
I find it interesting.
Francisco
http://www2.oanda.com/cgi-bin/msgboard/ultimatebb.cgi?ubb=get_topic;f=17;t=004620;p=2#000029
Pescador wrote:
There are 3 (and probably many more that I do not know) profitable strategies in this market I know of:
1. Scalping with high leverage and DISCIPLINED mental stops. You will win big IF YOU LEARN HOW TO LOSE.
If you have the detachment of a Buddha you will succeed and have fun like him:
http://www.amazon.com/Divine-Madman-Sub ... 74&sr=11-1
2. Hedging with moderate leverage. In contrast to the common TP/SL strategies you will have
the freedom to take profit or take loss in an intelligent way, WHENEVER IT FITS YOUR STRATEGY.
You will need the flexibility of a chameleon with this strategy.
If you have a synthetic hedging triangle, you have at least 6 directions you can trade all the time.
No hurry, no stress, no desperation means less mistakes. It has been explained many times in
these forums, just search for it. Read Weej's posts, they reveal a lot of it. The rest is just trying it out.
3. Long term investing with 1:1 or less leverage. With the patience of a saint, you will gain
MOST of your trades with time. Just wait.
But as it has been many times explained on Oanda forums,
1. scalping can never work. It leads to fast margin calls all the time.
2. hedging never works. It bleeds you out slowly due to too much burden of negative
interest, too much payed spreads/commissions and too much margin tied up.
3. long term investing does not work due to too little leverage and too little gain.
SO DO NOT TRY ANY OF THESE!!!!
YOU ARE GOOD THE WAY YOU ARE!!!
As scalpers, we have fun to take your money.
As hedgers we will take your money when we see it fit. No hurry, no stress, no desperation.
As long time investors we will take your money ANYWAY in the end.
SO PLEASE, STAY THE WAY YOU ARE.
And the best of it: in the end you will blame Oanda, not us....
AND OF COURSE NOT YOURSELF
PS.: If you decide trying these strategies, in spite all these warnings, please do try them in 1 account all together at the same time.
It makes our work much easier.
I find it interesting.
Francisco
Please add www.kreslik.com to your ad blocker white list.
Thank you for your support.
Thank you for your support.
-
monolisa
- rank: 150+ posts
- Posts: 351
- Joined: Fri Jun 12, 2009 11:38 am
- Reputation: 0
- Location: All Quiet on the Western Front
- Gender:
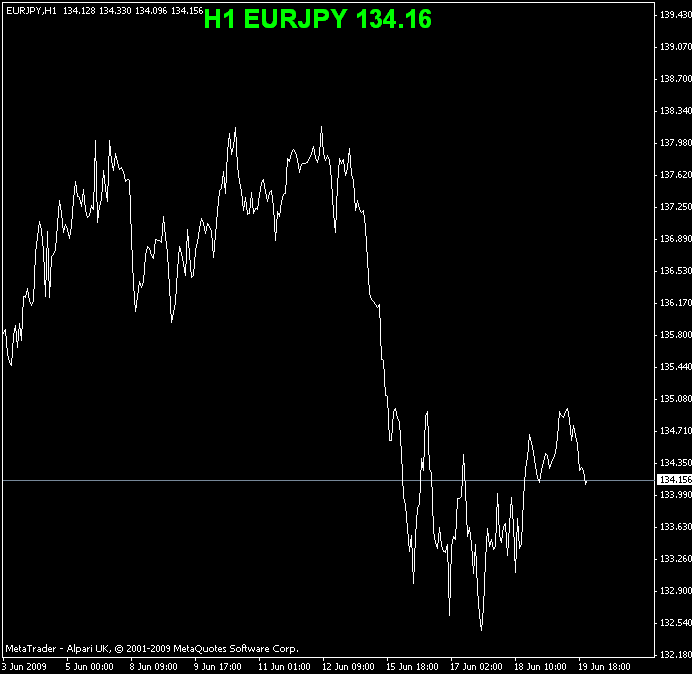
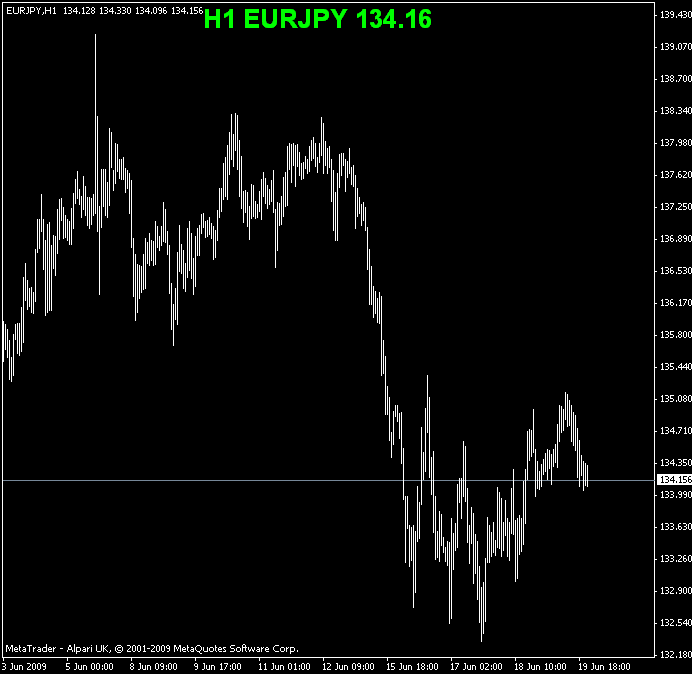
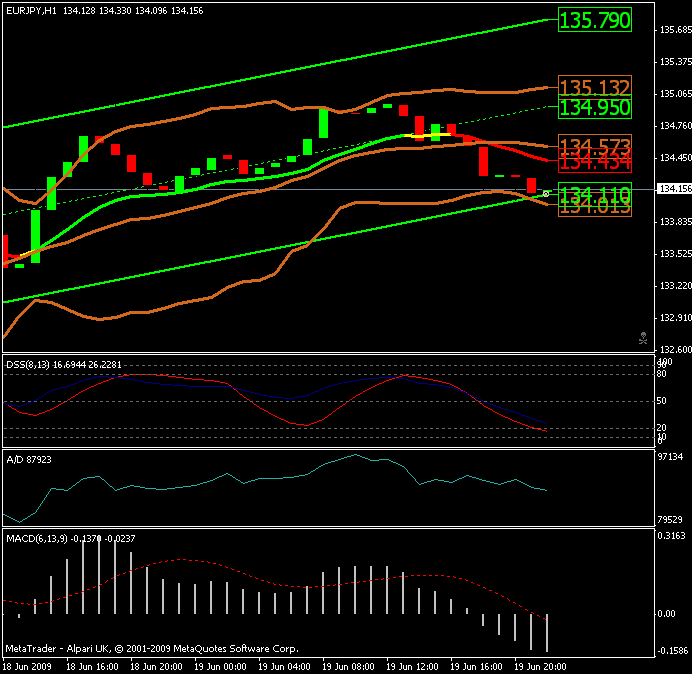
A combination of Mighty Zone and Horizontal lines trade. 200++ pips up for grab.
No Squiggly lines, pure PA!!
Lis
No Squiggly lines, pure PA!!
Lis
"Know your enemy and know yourself, find naught in fear for 100 battles. Know yourself but not your enemy, find level of loss and victory. Know neither your enemy or yourself, wallow in defeat every time." - Sun Tzu
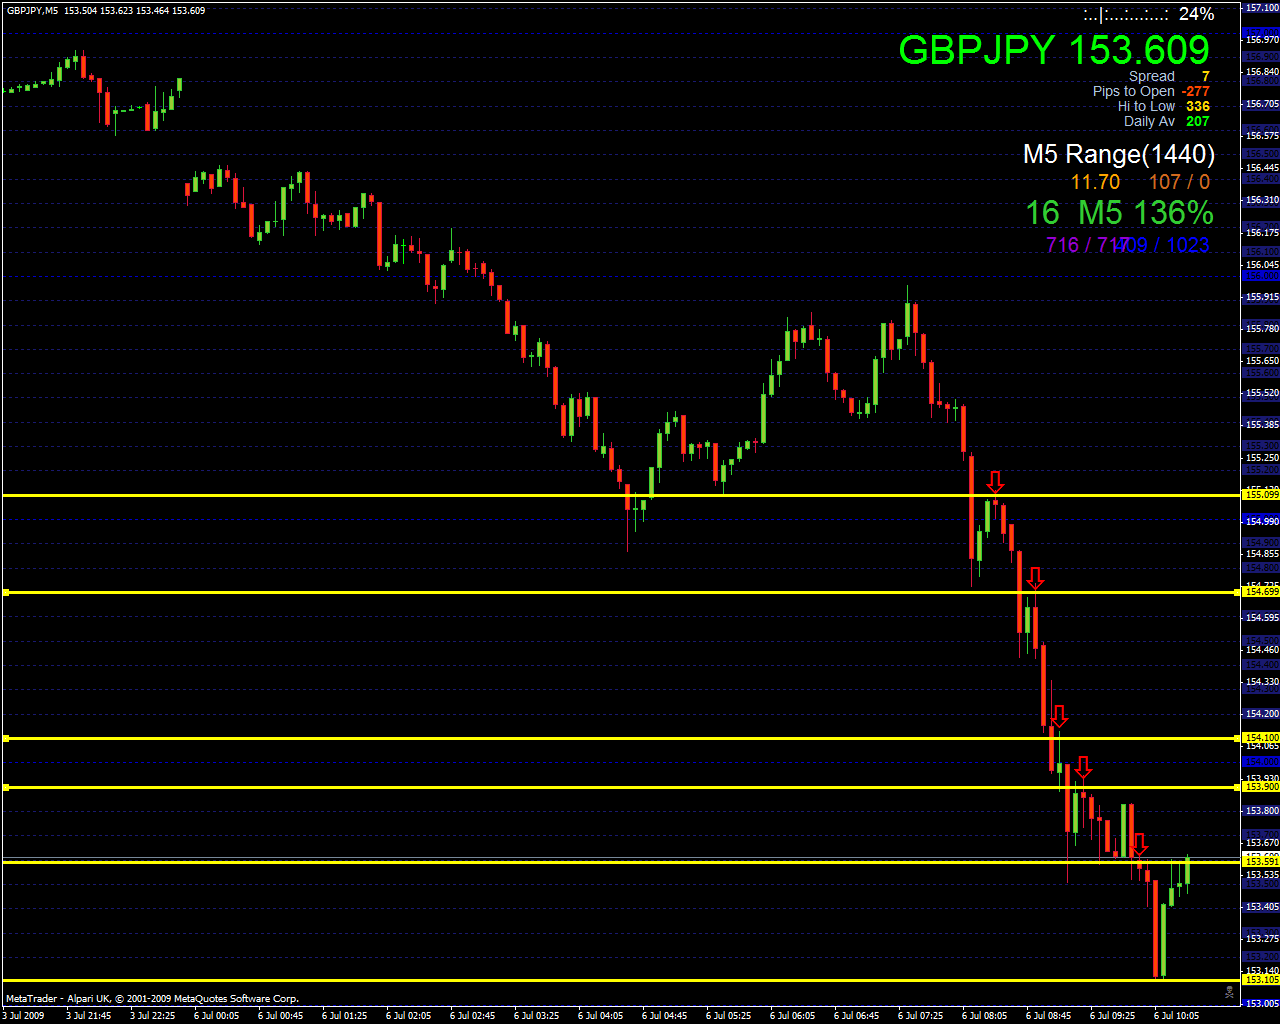
A few zline trades for today. I am only trading GBPUSD. There are more than enough opportunities to grow your account 2-5% a day conservatively without risking more than 3% of your account. I look for one maybe 2 trades a day at most!
I plan to execute flawlessly this one strategy on just one pair. For the past month my live account has grown 46%. I plan on only trading 10-15 days per month since there may not be perfect setups eveyday. Not trading is ok if the probability that you seek is not present.
My major hurdle is remaining focused and not being distracted by the next new indicator. I have deleted all but 12 indicators. They are probably not even needed. A bare chart with hand drawn horizontal lines is really all I need.
--ZZ


zapzinig wrote:A few zline trades for today. I am only trading GBPUSD. There are more than enough opportunities to grow your account 2-5% a day conservatively without risking more than 3% of your account. I look for one maybe 2 trades a day at most!
I plan to execute flawlessly this one strategy on just one pair. For the past month my live account has grown 46%. I plan on only trading 10-15 days per month since there may not be perfect setups eveyday. Not trading is ok if the probability that you seek is not present.
My major hurdle is remaining focused and not being distracted by the next new indicator. I have deleted all but 12 indicators. They are probably not even needed. A bare chart with hand drawn horizontal lines is really all I need.
--ZZ
great trading
this is exactly what MO was saying the other day-------- it works for some people bec they are discretionary traders
this way of trading is not a "system" you have to use some common sense with it.
zapzing pretty much summed it up when he said this "A bar chart with hand drawn horizontal lines is really all I need."
i hope that the ones that have not been able to grasp this notice AGAIN that here is yet another person that is trading the same thought process but just a little bit different, and amazingly it works for him/her yet again.
1. take all the crap of your charts
2. see held profit---based on momentum
3. act accordingly
4. zero out other traders
5. repeat
-
monolisa
- rank: 150+ posts
- Posts: 351
- Joined: Fri Jun 12, 2009 11:38 am
- Reputation: 0
- Location: All Quiet on the Western Front
- Gender:
Great work, zapzinig.
zline trade works best with momentum, and as such is most profitable with large range pairs like GBPJPY and GBPUSD (the one you have chosen). Given GU has lower spread it's the ideal pair. 200+ pips daily range is a no brainer!!
Lis
zline trade works best with momentum, and as such is most profitable with large range pairs like GBPJPY and GBPUSD (the one you have chosen). Given GU has lower spread it's the ideal pair. 200+ pips daily range is a no brainer!!
Lis
"Know your enemy and know yourself, find naught in fear for 100 battles. Know yourself but not your enemy, find level of loss and victory. Know neither your enemy or yourself, wallow in defeat every time." - Sun Tzu
Thanks es/pip,
I have learned a great deal from your charts, they are the most basic and most powerful. These setups happen over and over again, most of the time they work out exactly to the pip. When they go wrong you know and you take action and exit with as little loss as possible. My hard SL is 30 pips (3% of account), as I get better on the entries, I can see moving my SL to 19-23 pips and adding additional lots to keep my risk to 3%
If you watch and focus on how the market responds when it reaches a zline/zone you can guage market reaction.
Thanks MO and es/pip for your insight charts and guidance.
--ZZ
es/pip wrote:zapzinig wrote:A few zline trades for today. I am only trading GBPUSD. There are more than enough opportunities to grow your account 2-5% a day conservatively without risking more than 3% of your account. I look for one maybe 2 trades a day at most!
I plan to execute flawlessly this one strategy on just one pair. For the past month my live account has grown 46%. I plan on only trading 10-15 days per month since there may not be perfect setups eveyday. Not trading is ok if the probability that you seek is not present.
My major hurdle is remaining focused and not being distracted by the next new indicator. I have deleted all but 12 indicators. They are probably not even needed. A bare chart with hand drawn horizontal lines is really all I need.
--ZZ
great trading
this is exactly what MO was saying the other day-------- it works for some people bec they are discretionary traders
this way of trading is not a "system" you have to use some common sense with it.
zapzing pretty much summed it up when he said this "A bar chart with hand drawn horizontal lines is really all I need."
i hope that the ones that have not been able to grasp this notice AGAIN that here is yet another person that is trading the same thought process but just a little bit different, and amazingly it works for him/her yet again.
1. take all the crap of your charts
2. see held profit---based on momentum
3. act accordingly
4. zero out other traders
5. repeat
Please add www.kreslik.com to your ad blocker white list.
Thank you for your support.
Thank you for your support.