Never Lose Again
Moderator: moderators
-
TheRumpledOne

- rank: 10000+ posts

- Posts: 15761
- Joined: Sun May 14, 2006 9:31 pm
- Reputation: 3047
- Location: Oregon
- Real name: Avery T. Horton, Jr.
- Gender:

- Contact:
Found a TRADING PLAN TEMPLATE on www.trade2win.com.
- Attachments
-
 T2W_Trading_Plan_Template_2005.pdf
- (160.13 KiB) Downloaded 566 times
IT'S NOT WHAT YOU TRADE, IT'S HOW YOU TRADE IT!
Please do NOT PM me with trading or coding questions, post them in a thread.
Please do NOT PM me with trading or coding questions, post them in a thread.
Please add www.kreslik.com to your ad blocker white list.
Thank you for your support.
Thank you for your support.


Since I was asked this question yet again I will *sigh* and answer it yet again 
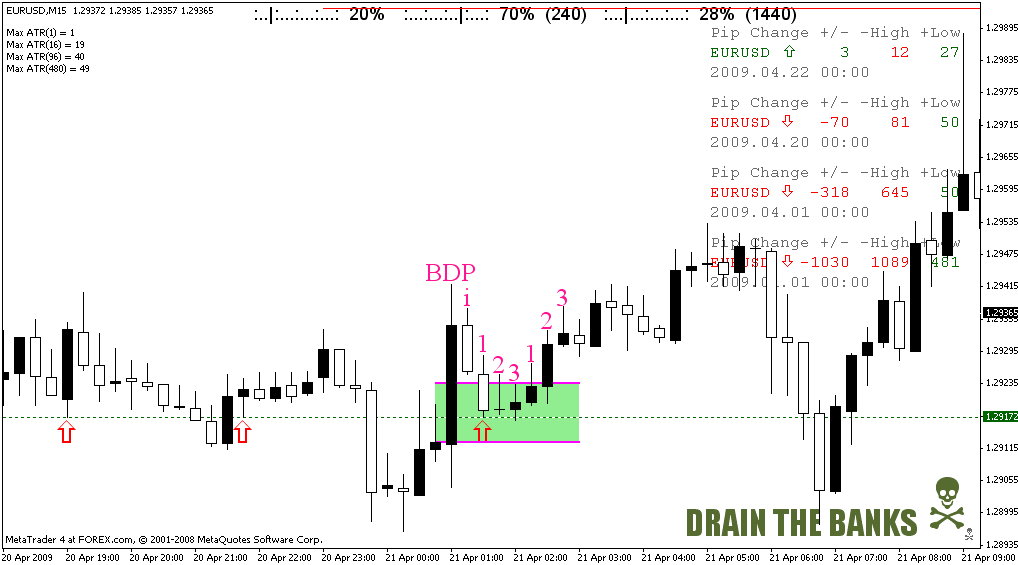
A zero line is ANY LINE placed within the area from the close of the prev. candle to the midpoint of the momentum candle.
The ZL trade is ONLY for the candle marked "i":
You are looking for price to create an illusion that excites traders into trading against momentum and are looking to profit from a quick reversal that ends with the 'i" candle closing in the direction of profit.
Weather or not you hold for more than 1 candle, AFTER "i" closes in the direction of profit, is up to you and your judgment.
Price trading above the momentum bar is a clear indication to trade with momentum and forget about retracements.
After the "i" candle closes the only thing that you have left is a S&R trade which can be far more dangerous than a momentum trade.
Next we have the No Trade or Price Failure area.
If price fails to close in the direction of profit beyond a momentum bar then you are likely looking at a possible reversal in the near future.
Again the "i bar" is the bar that you are trading in the direction of profit and after that bar closes you can consider the possibility of a price reversal.
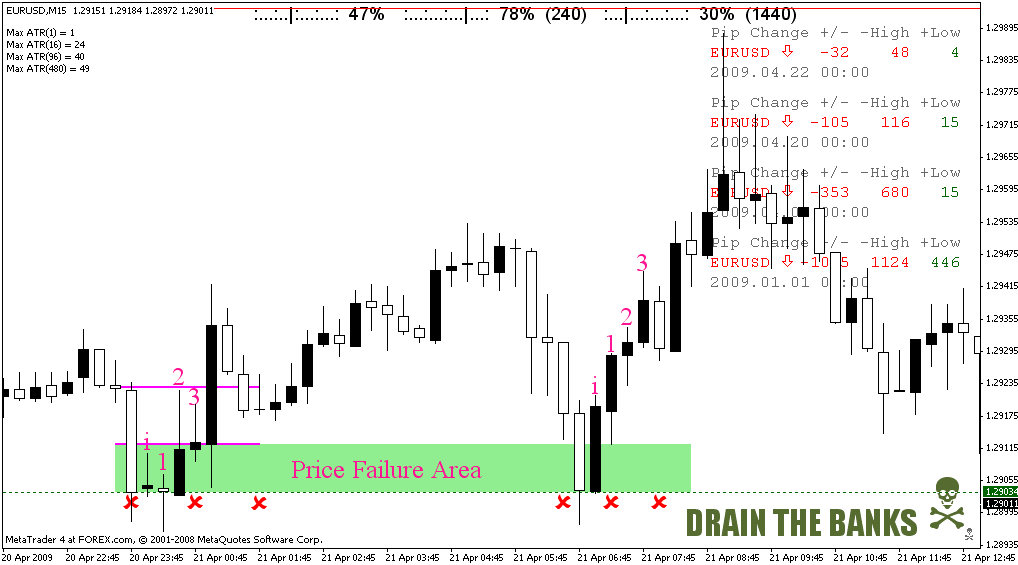
Please add www.kreslik.com to your ad blocker white list.
Thank you for your support.
Thank you for your support.
-
razorboy

- rank: 500+ posts

- Posts: 627
- Joined: Tue Oct 21, 2008 2:06 am
- Reputation: 0
- Location: Toronto
- Gender:
- Contact:
Quick question,
When you scale down to the lower time frames with this approach......... and you start entering trades, are you liquidating positions - (taking profits along the way) - or just building postions and then liquidating when they hit your line.
When you scale down to the lower time frames with this approach......... and you start entering trades, are you liquidating positions - (taking profits along the way) - or just building postions and then liquidating when they hit your line.
es/pip wrote:MightyOne wrote:es/pip wrote:Ok now that I am somewhat on the same page as you
When does the count (0,00) start over/how long is the measurement good for----only the current bar?
If bars 0 and 00 do not effect the price action do you restart the count as the new bars form?
If the measurement of 0,00 does effect the price action do you still walk the count forward as new bars form?
Not sure I expressed that the way I wanted to ----if not clear, I will do it on charts
For TRO's mental health let us use 0 as the current bar, 1 as the prev. bar (0), & 2 as the bar before that (00).
The first thing before any other consideration is the breakout; the
breakout starts it all.
The range of 1 & 2 from the low (in the case of a high BO) pushes the line up if:
1. they are higher than the breakout line.
2. the price on the current bar touches that price.
The lines remain until they are either moved higher or the candle closes and there is another BO.
Again, It all starts with the breakout!
Outside bars are treated differently:
The breakout with the greatest Iperiod is the line that stays.
The 1 and 2 candle can then push that line further if the range
is great enough and price moves to that price level.
aside from that a new BO sets the next line.
This Dynamic trend is a combination of momentum and Dynamic Fibs S&R.
k thanks
i think i understand all of it now
this is so interesting that i may switch things up and trade this
the only thing that ever "bothered" me about the zl/mz was having to wait so long for a correct setup----due to, when i first started trading was scalping stocks(before they changed it to .01 a tick) and i traded very large total volume at the end of the day. 1/16th here 1/4 here etc etc all day long
anyway
i have spent some time and going to spend a lot more tomorrow on this
but from what i have seen so far----using 30m-1hr,4hr for plotting the lines and trading 2-5 minute chart based off dfsr looks very interesting to say the least---and then applying your suggestion of expanding stops based on p/l makes it even look that much better
i love looking at new ideas that make sense----and this one may just completely take me away from zl's all together
it makes my head spin how you even think to come up with this kind of stuff----- i have spent thousands of hrs looking and trying all kinds of things and never have come up with anything remotely close to what you have presented
unreal
again thanks for what you are doing here
-
TheRumpledOne
- rank: 10000+ posts
- Posts: 15761
- Joined: Sun May 14, 2006 9:31 pm
- Reputation: 3047
- Location: Oregon
- Real name: Avery T. Horton, Jr.
- Gender:
- Contact:
-
TheRumpledOne
- rank: 10000+ posts
- Posts: 15761
- Joined: Sun May 14, 2006 9:31 pm
- Reputation: 3047
- Location: Oregon
- Real name: Avery T. Horton, Jr.
- Gender:
- Contact:
This is the way we drain the banks
drain the banks, drain the banks
This is the way we drain the banks
So early in the morning.
This is the way we take their pips
take their pips, take their pips
This is the way we take their pips
So early in the morning.
Last edited by TheRumpledOne on Wed Apr 22, 2009 6:25 pm, edited 3 times in total.
IT'S NOT WHAT YOU TRADE, IT'S HOW YOU TRADE IT!
Please do NOT PM me with trading or coding questions, post them in a thread.
Please do NOT PM me with trading or coding questions, post them in a thread.
-
Gert Frobe

- rank: 150+ posts

- Posts: 177
- Joined: Fri Jun 30, 2006 9:51 pm
- Reputation: 0
- Location: Arlington, Texas
- Real name: ben arata
- Gender:

TheRumpledOne wrote:Found a TRADING PLAN TEMPLATE on www.trade2win.com.
thanks avery this was a good read as well as somthing that you need to be able to answer the questions
airball
-
razorboy
- rank: 500+ posts
- Posts: 627
- Joined: Tue Oct 21, 2008 2:06 am
- Reputation: 0
- Location: Toronto
- Gender:
- Contact:
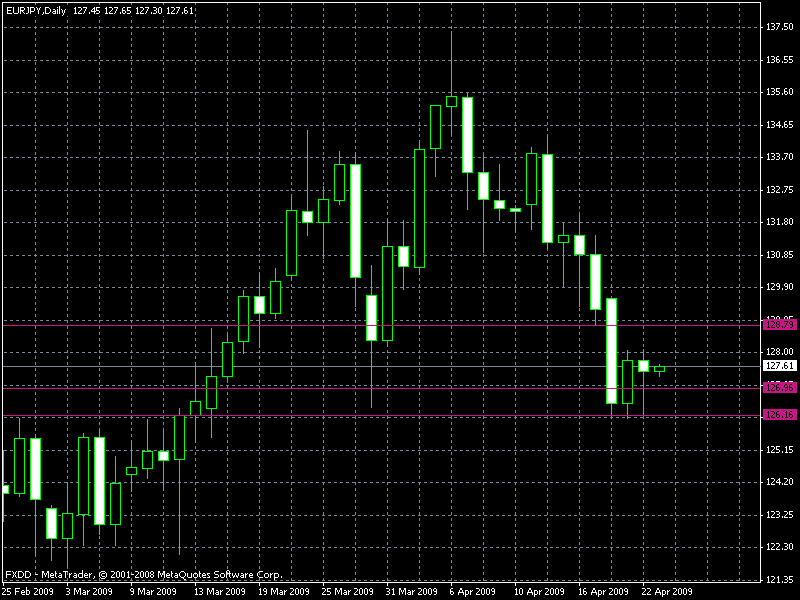
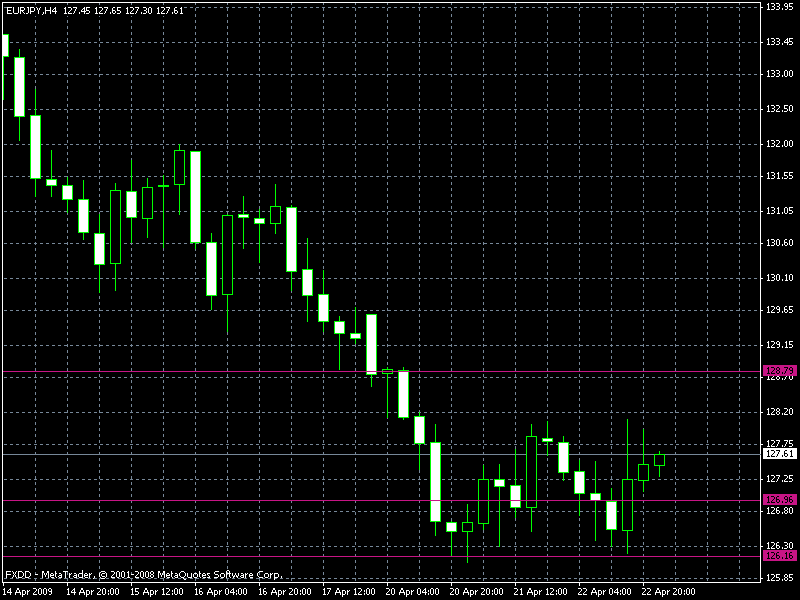
Dynamic Trend Bias
I was running thru MO's post and wanted to give this another shot.
As my basic set up I used a breakout from three days back to set up the dynamic trend - the pink lines are the addition of the ranges two candles previous to the downward break out bar -
Based on what I saw on the daily chart - price is above the lines - the bias is up/long - ATR for this pair is about 273
4 hour shot
1 hour
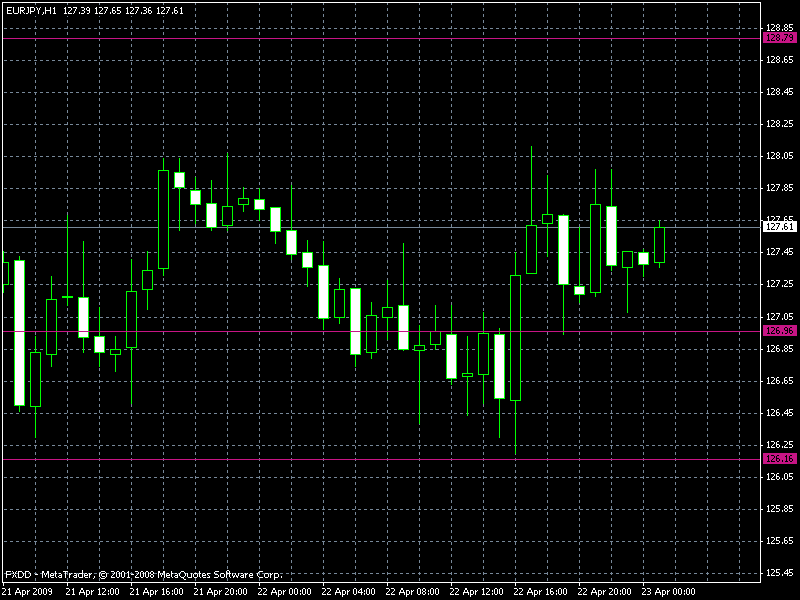
15 minute

I have 1% of capital at risk
I went long at 127.38 off of the 15 minute chart, but figured if I was looking to capture the ATR or so, the specific entry wasnt too much of an issue - SL is the at the upper most of the lower two pink lines - about 40 pips
The top pink line is the break out line - an initial target to aim for.
any input would be appreciated - was up about 30 pips, now sitting at 10 pips of profit.
Now I know MO had talked about adding profits to your SL, to increase your staying power, but if I don't plan to sell until I hit my profit target, should I gradually increase my SL as price surges upward ( by the amount of each surge - which would be my theoretical profit if i closed the position)- would have the same effect of selling, and buying back in with a large SL. Correct?
Would love some input
As my basic set up I used a breakout from three days back to set up the dynamic trend - the pink lines are the addition of the ranges two candles previous to the downward break out bar -
Based on what I saw on the daily chart - price is above the lines - the bias is up/long - ATR for this pair is about 273
4 hour shot
1 hour
15 minute
I have 1% of capital at risk
I went long at 127.38 off of the 15 minute chart, but figured if I was looking to capture the ATR or so, the specific entry wasnt too much of an issue - SL is the at the upper most of the lower two pink lines - about 40 pips
The top pink line is the break out line - an initial target to aim for.
any input would be appreciated - was up about 30 pips, now sitting at 10 pips of profit.
Now I know MO had talked about adding profits to your SL, to increase your staying power, but if I don't plan to sell until I hit my profit target, should I gradually increase my SL as price surges upward ( by the amount of each surge - which would be my theoretical profit if i closed the position)- would have the same effect of selling, and buying back in with a large SL. Correct?
Would love some input
Please add www.kreslik.com to your ad blocker white list.
Thank you for your support.
Thank you for your support.