The XAU/USD rate fluctuates around $1,987 - the July high was formed around this price. And having overcome it, the market stabilized, as evidenced by the ADX indicator, which dropped to its minimum for the month.
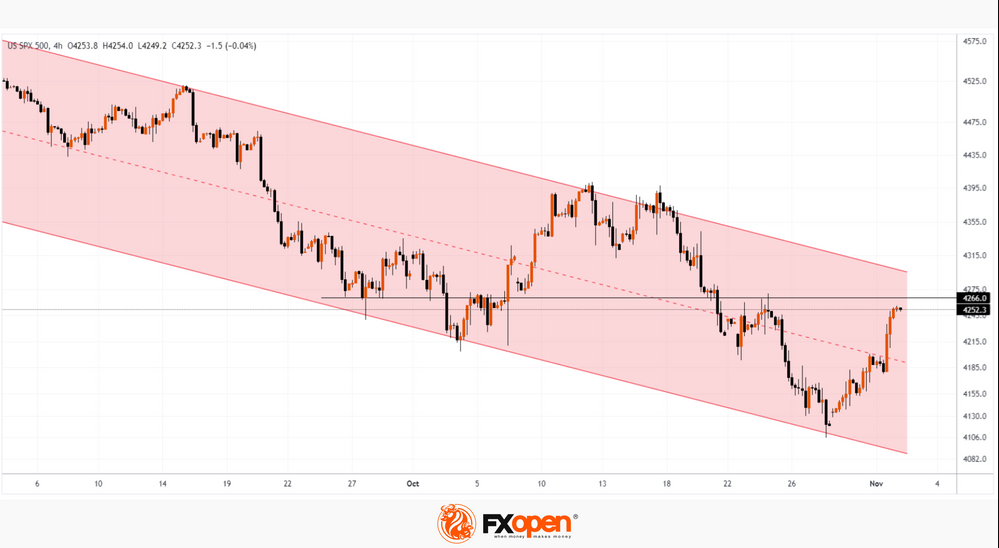
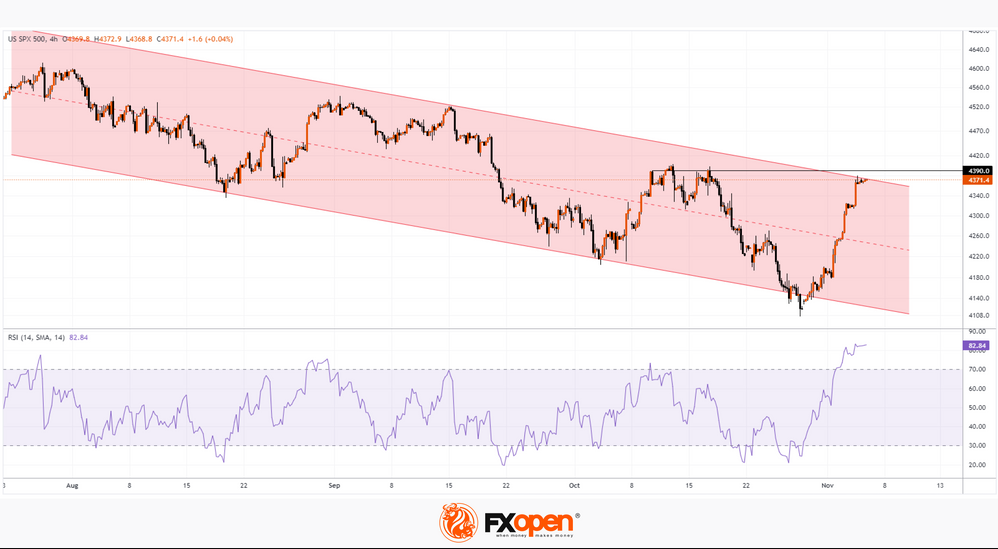
Gold is up about 9% in three weeks on war fears. Moreover, if we take the year 2023, then gold has become a more profitable investment than the stock market, since according to Dow Jones Market Data, as of Thursday's close, the S&P 500 SPX index has gained 7.8% since January 1, at that time as front-month gold futures gained 9.2% over the same period.
On Friday, gold traders are focused on the release of US Core PCE Price Index values at 15:30 GMT+3. News about inflation could cause significant turbulence in the gold market.
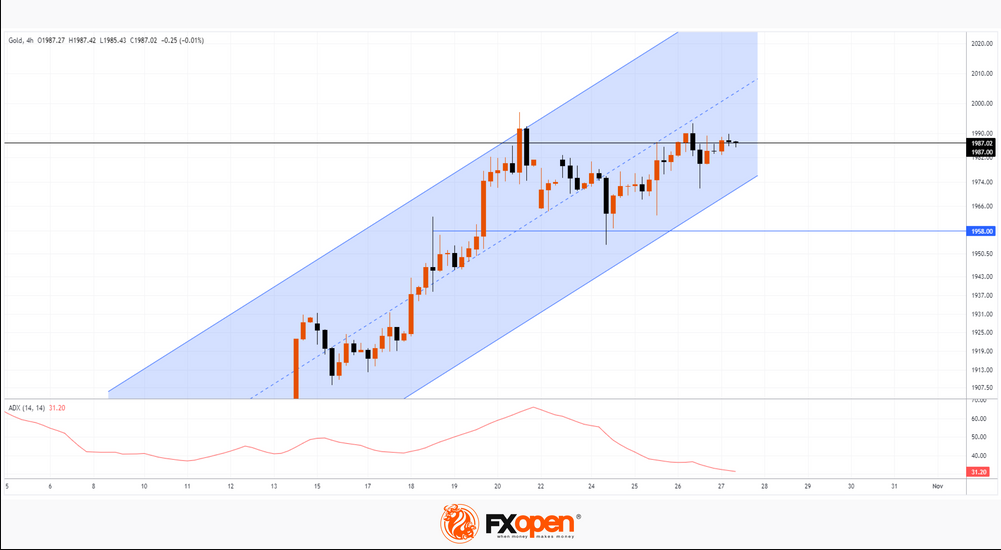
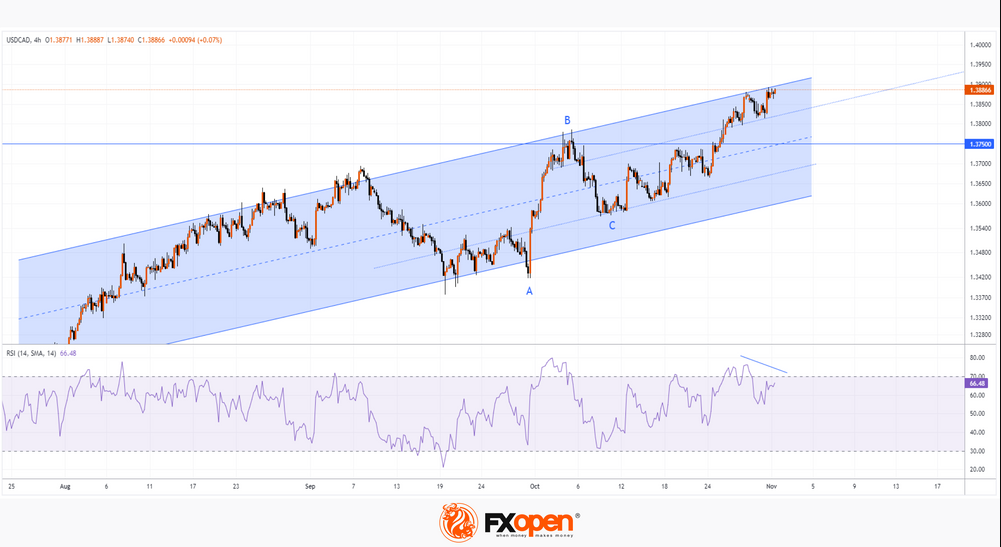
The chart shows that the upside momentum within the ascending channel is fading around the USD 1,978 level as the price moves away from the upper boundary and the median line shows signs of resistance. Although the long lower shadows at the lows of October 24-26 indicate that gold is being actively bought up on declines.
Technical support for the market can be provided by:
-> lower border of the channel;
-> level 1,958, which previously served as resistance, but has now changed its role.
The current stabilization of prices can be explained by the proximity of the psychological level of USD 2,000. News of the escalation from the Middle East could push the price beyond a round figure.
This article represents the opinion of the Companies operating under the FXOpen brand only. It is not to be construed as an offer, solicitation, or recommendation with respect to products and services provided by the Companies operating under the FXOpen brand, nor is it to be considered financial advice.