Hello Igazi; thanks for your post - I've been thinking it over while I've been off sick with the flu: "aim to do less while achieving more".
I keep getting sucked into the individual candle action and lose sight of the bias/trend, which makes me a busy fool. Despite my best efforts, I keep losing perspective while scalping. So I'm thinking of slowing down, doing less and giving my trades more time to travel further.
To do this I'm taking a cue from some of things I've read in your posts: forming a theme based on the higher timeframes (I'm using daily as a 'big levels' reference and hourly as a 'things that are happening during my trading session' reference) and using the M1 to trade within that.
I'm also attempting to use dot charts for M1 in order to reduce the cognitive load.. because of that I'm dropping back to using micros instead of mini ES contracts so that I can use wider stops while setting targets based on the hourly levels, thus aiming for much better RR.
Attached screenshot is my attempt to trade the theme - market moving to first blue horizontal line (target on the hourly) while taking some scalps at stall points on the way up.
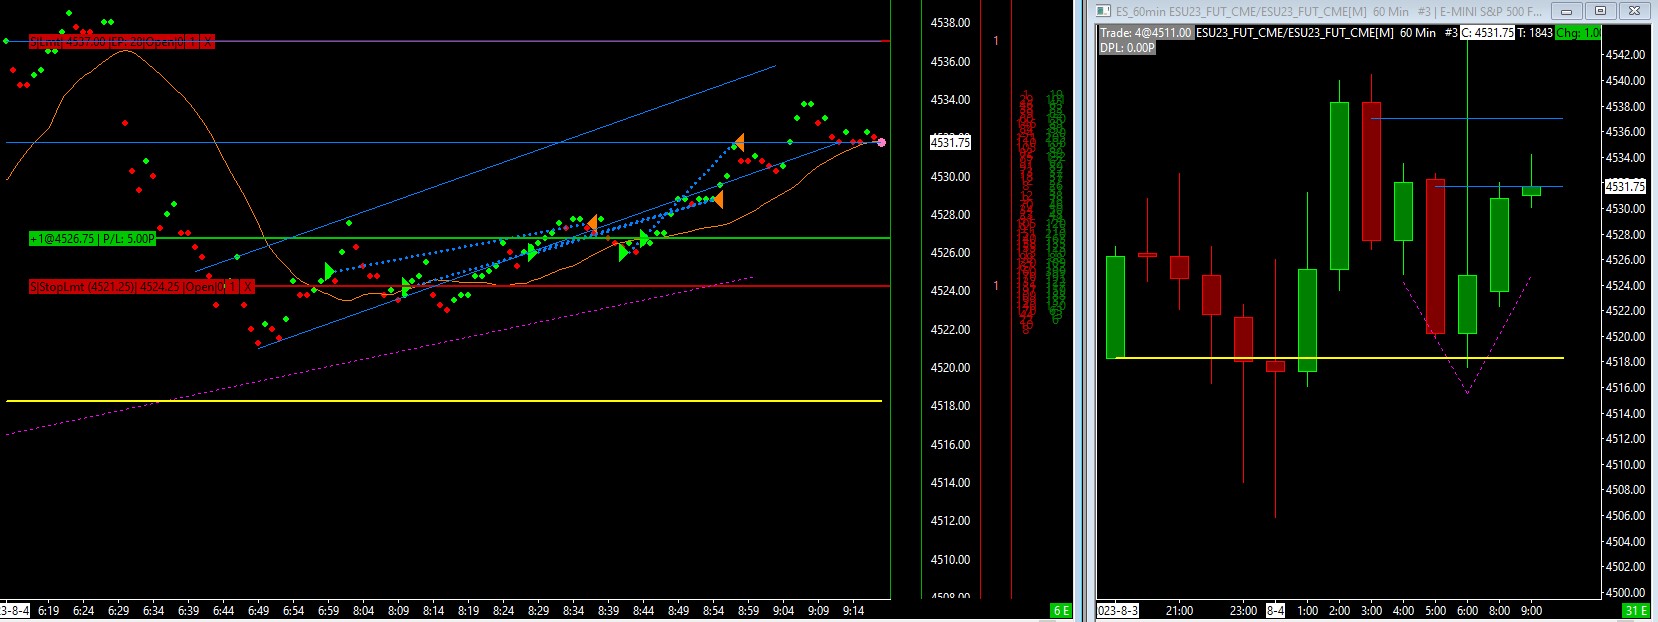
- 2023-08-04-MES-dots-fills.jpg (169.59 KiB) Viewed 1080 times
By seeing the higher closes on the dot chart and believing that price really can move up to a higher timeframe level, I was able to work with the money and do more with less.
I'd like to continue developing this kind of approach - I can't be present for a lot of the session action, but if I can "position scalp" (?) my entries within a larger context then I might find a viable way to work with the markets, avoiding getting churned and burned.
Posts from you and Don have helped to cement the idea of risking a little and letting it run over time.


