Daily analysis from FXOpen

forex live trades, setups, charts

Moderator: moderators

User avatar
whiteking
rank: 150+ posts
rank: 150+ posts
Posts: 350
Joined: Fri Aug 11, 2017 2:25 am
Reputation: 32
Gender: None specified

Re: Daily analysis from FXOpen

Postby whiteking » Wed Jun 21, 2023 12:13 pm

Market Analysis: EUR/USD Corrects Gains While USD/CHF Aims Higher

Image

EUR/USD started a decent increase above the 1.0860 resistance. USD/CHF is rising and might aim a move toward the 0.9055 resistance.

Important Takeaways for EUR/USD and USD/CHF Analysis Today
  • The Euro gained pace after it broke the 1.0860 resistance against the US Dollar.
  • There is a major bullish trend line forming with support near 1.0905 on the hourly chart of EUR/USD at FXOpen.
  • USD/CHF is recovering higher above the 0.8945 resistance zone.
  • There is a key rising channel forming with support near 0.8970 on the hourly chart at FXOpen.

EUR/USD Technical Analysis

On the hourly chart of EUR/USD at FXOpen, the pair started a decent increase and was able to settle above the 1.0860 resistance zone. The Euro was able to climb further higher above the 1.0920 level against the US Dollar.

Finally, it tested the 1.0970 zone. A high is formed near 1.0970 and the pair is now correcting gains. There was a move below the 23.6% Fib retracement level of the upward move from the 1.0803 swing low to the 1.0970 high.

Image

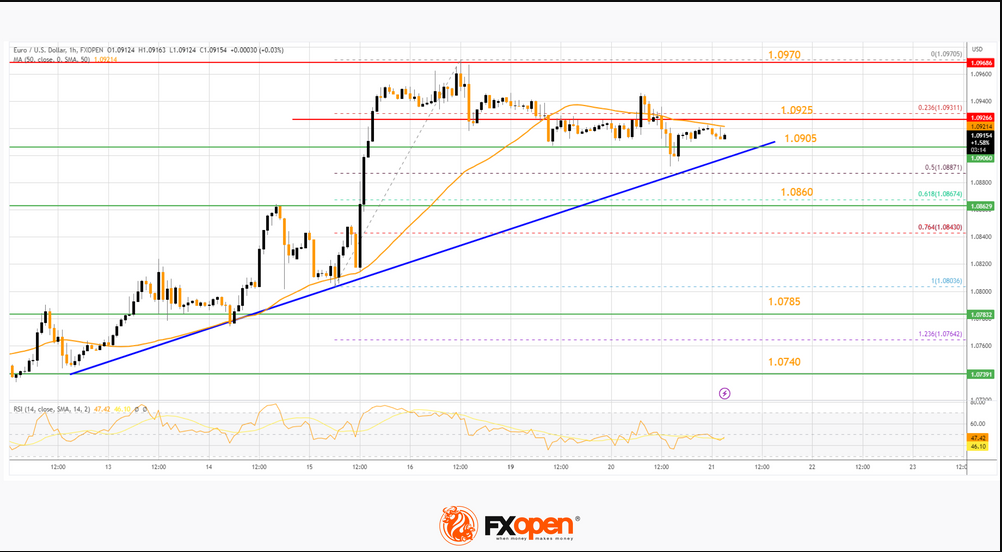
The pair is now trading below the 50-hour simple moving average. However, there is a major bullish trend line forming with support near 1.0905.

The next major support is near the 61.8% Fib retracement level of the upward move from the 1.0803 swing low to the 1.0970 high at 1.0860. A downside break below the 1.0860 support could send the pair toward the 1.0785 level.

Immediate resistance on the EUR/USD chart is near the 50-hour simple moving average at 1.0925. The first major resistance is near the 1.0970 level.

An upside break above the 1.0970 level might send the pair toward the 1.1000 resistance. The next major resistance is near the 1.1040 level. Any more gains might open the doors for a move toward the 1.1080 level.

Disclaimer: This publication represents the News of the Companies operating under the FXOpen brand only. It is not to be construed as an offer, solicitation, or recommendation with respect to products and services provided by the Companies operating under the FXOpen brand, nor is it to be considered financial advice.
I trade at FXOpen

Please add www.kreslik.com to your ad blocker white list.
Thank you for your support.

User avatar
whiteking
rank: 150+ posts
rank: 150+ posts
Posts: 350
Joined: Fri Aug 11, 2017 2:25 am
Reputation: 32
Gender: None specified

Re: Daily analysis from FXOpen

Postby whiteking » Thu Jun 22, 2023 1:56 pm

Market Analysis: Why the Price of Bitcoin Rose to USD 30k

Image

Yesterday, the BTC price topped USD 30k for the first time since April. There may be several reasons, among them:

-> Powell's speech to lawmakers on Capitol Hill yesterday. The Fed chief said further rate hikes are a pretty good guess as to where the Fed is heading. The dollar index reacted to his hawkish statement with a fall. At the same time, it pushed up the bitcoin rate against the dollar. In addition, Powell paid tribute to cryptocurrencies, saying that they are stable and adding that the Fed views stablecoins as a form of money;

->after the negative news background related to the Fed lawsuits, positive events followed, indicating the interest of institutional firms in the US in the crypto market. For example, the BlackRock fund (more than USD 8 trillion under management) filed an application last week to launch an ETF based on bitcoin. And a new cryptocurrency exchange, EDX Markets, backed by Citadel Securities, Fidelity and Schwab, has gone live;

-> change in the balance of supply and demand in the market after the price of bitcoin breaks through the psychological level of USD 25k.

Image

The BTC/USD chart shows that the rise in the price of bitcoin this week met resistance (1) from the upper line of the descending channel, shown in red. But after yesterday's violent rally, the price reached a resistance block, which is formed by:
  • the psychological level of USD 30k for bitcoin;
  • line (2) parallel channel.
It is possible that in the wake of the hype, the bulls will attack the high of the year, but at the same time, their success increases the likelihood of a correction.

FXOpen offers the world's most popular cryptocurrency CFDs*, including Bitcoin and Ethereum. Floating spreads, 1:2 leverage, 30% margin call, 0.01 lot minimum transaction size with no maximum — at your service. Open your trading account now or learn more about making your money go further with FXOpen.

*At FXOpen UK and FXOpen AU, Cryptocurrency CFDs are only available for trading by those clients categorised as Professional clients under FCA Rules and Professional clients under ASIC Rules respectively. They are not available for trading by Retail clients.

This article represents FXOpen Companies’ opinion only, it should not be construed as an offer, solicitation, or recommendation with respect to FXOpen Companies’ products and services or as financial advice.


Read more...

Disclaimer: This publication represents the News of the Companies operating under the FXOpen brand only. It is not to be construed as an offer, solicitation, or recommendation with respect to products and services provided by the Companies operating under the FXOpen brand, nor is it to be considered financial advice.

RISK WARNING: Trading on the Forex market involves substantial risks, including complete possible loss of funds and other losses and is not suitable for all members. Clients should make an independent judgement as to whether trading is appropriate for them in the light of their financial condition, investment experience, risk tolerance and other factors.
I trade at FXOpen

User avatar
whiteking
rank: 150+ posts
rank: 150+ posts
Posts: 350
Joined: Fri Aug 11, 2017 2:25 am
Reputation: 32
Gender: None specified

Re: Daily analysis from FXOpen

Postby whiteking » Fri Jun 23, 2023 1:16 pm

Market Analysis: Gold Price and Crude Oil Price Turn Red

Image

Gold price is moving lower below the $1,928 support. Crude oil price is also declining and remains at a risk of more losses below $69.00.

Important Takeaways for Gold and Oil Prices Analysis Today
  • Gold price failed to clear the $1,965 resistance and start a fresh decline against the US Dollar.
  • It is now following a key bearish trend line with resistance near $1,915 on the hourly chart of gold at FXOpen.
  • Crude oil prices are also moving lower below $71.20 and $70.20 levels.
  • There was a break below a major bullish trend line with support near $70.85 on the hourly chart of XTI/USD at FXOpen.
Gold Price Technical Analysis

On the hourly chart of Gold at FXOpen, the price struggled to start a fresh increase above the $1,965 resistance. The price started a fresh decline below the $1,938 support.

There was a close below the 50-hour simple moving average and $1,928. It tested the $1,910 support zone. A low is formed at $1,910.40 and the price is now consolidating losses. It is following a key bearish trend line with resistance near $1,915.

Image

The trend line is close to the 23.6% Fib retracement level of the downward move from the $1,955 swing high to the $1,910 low. The next major resistance is near the 50-hour simple moving average at $1,928.

The 61.8% Fib retracement level of the downward move from the $1,955 swing high to the $1,910 low is also near $1,928. An upside break above the $1,928 resistance could send Gold price toward $1,938. Any more gains may perhaps set the pace for an increase toward the $1,955 level.

Initial support on the downside is near the $1,910 level. The first major support is near the $1,900 level. The main support sits near the $1,885 level. If there is a downside break below the $1,885 support, the price might decline further. In the stated case, the price might drop toward the $1,865 support.

Disclaimer: This publication represents the News of the Companies operating under the FXOpen brand only. It is not to be construed as an offer, solicitation, or recommendation with respect to products and services provided by the Companies operating under the FXOpen brand, nor is it to be considered financial advice.
I trade at FXOpen

User avatar
whiteking
rank: 150+ posts
rank: 150+ posts
Posts: 350
Joined: Fri Aug 11, 2017 2:25 am
Reputation: 32
Gender: None specified

Re: Daily analysis from FXOpen

Postby whiteking » Mon Jun 26, 2023 1:43 pm

Market Analysis: GBP/USD Eyes Fresh Increase, USD/CAD Could Extend Losses
Image

GBP/USD faced resistance near 1.2845 and started a downside correction. USD/CAD is struggling below 1.3210 and might decline further.

Important Takeaways for GBP/USD and USD/CAD
  • The British Pound started a downside correction below the 1.2845 zone.
  • There is a key bearish trend line forming with resistance near 1.2740 on the hourly chart of GBP/USD at FXOpen.
  • USD/CAD declined below the 1.3210 and 1.3185 support levels.
  • A connecting bearish trend line is forming with resistance near 1.3185 on the hourly chart at FXOpen.

GBP/USD Technical Analysis

On the hourly chart of GBP/USD at FXOpen, the pair was able to climb above the 1.2800 resistance zone. However, the bears were active near the 1.2845 zone.

As a result, the pair started a downside correction below the 1.2780 and 1.2740 support levels. The pair even spiked below 1.2700 before the bulls appeared near 1.2690. A low is formed near 1.2684 and the pair is now consolidating losses.

Image

There was a move above the 23.6% Fib retracement level of the downward move from the 1.2841 swing high to the 1.2684 low. Immediate resistance on the GBP/USD chart is forming near the 50-hour simple moving average at 1.2732.

The next resistance is near a key bearish trend line at 1.2740. An upside break above the 1.2740 zone, the pair could rise toward 1.2780. It coincides with the 61.8% Fib retracement level of the downward move from the 1.2841 swing high to the 1.2684 low.

Any more gains might open the doors for a test of 1.2845. On the downside, initial support is near the 1.2720 area. The next major support is near the 1.2690 level. If there is a break below 1.2690, the pair could extend its decline. The next key support is near the 1.2640 level. Any more losses might call for a test of the 1.2580 support.

Disclaimer: This publication represents the News of the Companies operating under the FXOpen brand only. It is not to be construed as an offer, solicitation, or recommendation with respect to products and services provided by the Companies operating under the FXOpen brand, nor is it to be considered financial advice.
I trade at FXOpen

User avatar
whiteking
rank: 150+ posts
rank: 150+ posts
Posts: 350
Joined: Fri Aug 11, 2017 2:25 am
Reputation: 32
Gender: None specified

Re: Daily analysis from FXOpen

Postby whiteking » Mon Jun 26, 2023 2:31 pm

Market Analysis: The Price of Bitcoin Updates the Maximum of the Year, What's Next?

Image

After skyrocketing last week for the 3 reasons we wrote about earlier, the price of bitcoin hit a 2023 high on Friday, surpassing USD 31,400 per bitcoin. This was facilitated by the news that the SEC approved the first exchange-traded fund (ETF) of bitcoin futures with leverage.

In April, the bulls were already above the psychological level of USD 30k per bitcoin, but after that a pullback followed, culminating in the price dropping below the psychological level of USD 25k per bitcoin. The BTC/USD market once again emphasized the emotionality of its participants — this is how you can interpret the tendency of the bitcoin exchange rate to the US dollar to make reversals after the breakdown of psychological levels.

What will happen next? Will the price of bitcoin follow the June breakdown according to the rollback scenario that was realized after the April breakdown? The probability of this is indicated by the bearish SHS patterns (head-and-shoulders), which formed when the price of bitcoin exceeded the level of 30k. You may also have deja vu, as the 2 peaks above 30k in 2023 resemble the 2 peaks (in April and November) above 60k in 2021.

Image

The ability of the price of bitcoin to recover from declines under the 30k level (if any) will give more evidence that the bull market is indeed sustainable.

Disclaimer: This publication represents the News of the Companies operating under the FXOpen brand only. It is not to be construed as an offer, solicitation, or recommendation with respect to products and services provided by the Companies operating under the FXOpen brand, nor is it to be considered financial advice.
I trade at FXOpen

Please add www.kreslik.com to your ad blocker white list.
Thank you for your support.

User avatar
whiteking
rank: 150+ posts
rank: 150+ posts
Posts: 350
Joined: Fri Aug 11, 2017 2:25 am
Reputation: 32
Gender: None specified

Re: Daily analysis from FXOpen

Postby whiteking » Tue Jun 27, 2023 2:57 pm

USDCAD Analysis: Low of the Year

Image

USD/CAD fell below 1.3130 this morning, a level not seen since September 2022. The strength of the Canadian dollar can be justified, among other things, by the fact that the inflation rate in Canada is lower than in the US.

In April, we wrote that a false bullish break (indicated by a circle) of a triangle (shown in green) could indicate that a genuine break would occur in a bearish direction and set a downtrend in the USD/CAD market. And so it happened.

Today's news on inflation in Canada (15:30 GMT+3) may significantly affect the dynamics of the current downtrend, which, if continued, has the prospect of reaching the bottom line (1) of the long-term channel.

Image


Disclaimer: This publication represents the News of the Companies operating under the FXOpen brand only. It is not to be construed as an offer, solicitation, or recommendation with respect to products and services provided by the Companies operating under the FXOpen brand, nor is it to be considered financial advice.
I trade at FXOpen

User avatar
whiteking
rank: 150+ posts
rank: 150+ posts
Posts: 350
Joined: Fri Aug 11, 2017 2:25 am
Reputation: 32
Gender: None specified

Re: Daily analysis from FXOpen

Postby whiteking » Wed Jun 28, 2023 2:02 pm

GBP/JPY Analysis: Highs Since December 2015
Image

The GBP/JPY chart shows that this currency pair is in an uptrend (nearly +17% YTD) which can be explained by differences in economies. While the UK is fighting a rate hike against inflation (which has shown double digits), Japan continues to pursue an ultra-soft monetary policy.

Technically, the bulls still have a chance to reach the upper boundary of the channel (shown in blue), where the psychological resistance level of 190 yen per pound passes, but the situation may change:

-> First, the Japanese authorities are concerned. “We closely monitor the movement of the currency. We will respond appropriately if it becomes excessive,” Vice Finance Minister and Chief Currency Strategist Masato Kanda said today. Recall that the Bank of Japan has already taken interventions in the foreign exchange market to support the yen in September and October last year — and this has yielded results.

-> Secondly, the bullish momentum for the pound may weaken. Bank of America analysts' forecast for the pound is one of the most pessimistic among the G10. In their opinion, the fight against inflation in the UK will be the strongest, and the risk of a hard landing has increased.

Image

(!) Please note that today at 16:30 GMT+3 speeches of the heads of central banks, including those of Japan and Great Britain, are scheduled. Get ready for a surge in volatility.

Disclaimer: This publication represents the News of the Companies operating under the FXOpen brand only. It is not to be construed as an offer, solicitation, or recommendation with respect to products and services provided by the Companies operating under the FXOpen brand, nor is it to be considered financial advice.
I trade at FXOpen

User avatar
whiteking
rank: 150+ posts
rank: 150+ posts
Posts: 350
Joined: Fri Aug 11, 2017 2:25 am
Reputation: 32
Gender: None specified

Re: Daily analysis from FXOpen

Postby whiteking » Thu Jun 29, 2023 2:08 pm

Market Analysis: Gold Drops to 3-Month Low
Image

Yesterday, a forum of heads of central banks was held, organized by the ECB, with speeches by Lagarde, Powell, Ueda, Bailey. In general (with the exception of Japan), according to bankers, they intend to maintain a tight monetary policy, not excluding new increases in interest rates, and plan that inflation will continue to decline.

Against the background of this information, the price of gold in dollars fell — perhaps because forecasts for lower inflation, according to market participants, reduce the value of gold as a "rescue" asset.

Image

The XAU/USD price chart shows that it has made a bearish breakout of the ascending channel that has been in place since last fall and is approaching the psychological level of USD 1,900 per ounce. A rebound can be expected from this level — for example, to the resistance of 1,935 USD per ounce, which was still a pronounced support in early May.

Disclaimer: This publication represents the News of the Companies operating under the FXOpen brand only. It is not to be construed as an offer, solicitation, or recommendation with respect to products and services provided by the Companies operating under the FXOpen brand, nor is it to be considered financial advice.
I trade at FXOpen

User avatar
whiteking
rank: 150+ posts
rank: 150+ posts
Posts: 350
Joined: Fri Aug 11, 2017 2:25 am
Reputation: 32
Gender: None specified

Re: Daily analysis from FXOpen

Postby whiteking » Fri Jun 30, 2023 1:13 pm

EURUSD Analysis: Double Bearish Pattern
Image

The EUR/USD chart indicates an interesting situation from the point of view of technical analysis, namely, a “nested” head-and-shoulders pattern.

The global bearish SHS pattern is formed by the peaks of February, April, June.
The local bearish SHS pattern is formed by three peaks formed in the second half of June. This should give confidence to the bears, who have statistics that indicate the effectiveness of the pattern.

Please note that inflation data will be published today:
-> 12:00 GMT+3: Core CPI Flash Estimate.
-> 12:00 GMT+3: US Core CPE is an indicator that the Fed pays special attention to.

Image

Earlier this week, both Lagarde and Powell reaffirmed their resolve to fight inflation. The release of news today can provoke sharp movements in the market — for example, a breakdown of the neck line of the local SHS pattern. Get ready for bursts of volatility.

Disclaimer: This publication represents the News of the Companies operating under the FXOpen brand only. It is not to be construed as an offer, solicitation, or recommendation with respect to products and services provided by the Companies operating under the FXOpen brand, nor is it to be considered financial advice.
I trade at FXOpen

User avatar
whiteking
rank: 150+ posts
rank: 150+ posts
Posts: 350
Joined: Fri Aug 11, 2017 2:25 am
Reputation: 32
Gender: None specified

Re: Daily analysis from FXOpen

Postby whiteking » Mon Jul 03, 2023 3:00 pm

GBP/USD Resumes Increase While EUR/GBP Faces Hurdle
Image

GBP/USD jumped above the 1.2650 and 1.2690 resistance levels. EUR/GBP declined and now trading below the 0.8595 resistance.

Important Takeaways for GBP/USD and EUR/GBP Analysis Today
  • The British Pound is trading in a bullish zone above 1.2650 against the US Dollar.
  • There was a break above a key bearish trend line with resistance near 1.2650 on the hourly chart of GBP/USD at FXOpen.
  • EUR/GBP started a fresh decline from the 0.8660 resistance zone.
  • There is a major bearish trend line forming with resistance near 0.8595 on the hourly chart at FXOpen.

GBP/USD Technical Analysis

On the hourly chart of GBP/USD at FXOpen, the pair started a fresh increase from the 1.2600 support zone. The British Pound climbed above the 1.2650 resistance zone against the US Dollar.

Image

The bulls were able to pump the pair above 1.2690 and the 50-hour simple moving average. The pair settled above the 61.8% Fib retracement level of the downward move from the 1.2759 swing high to the 1.2591 low.

Finally, the pair climbed above 1.2700 but struggled to clear the 1.2720 resistance zone. The pair is now consolidating above 1.2690. The GBP/USD chart indicates that the pair is facing resistance near the 76.4% Fib retracement level of the downward move from the 1.2759 swing high to the 1.2591 low at 1.2720.

The next major resistance is near the 1.2745 level. If the RSI moves above 70 and the pair climbs above 1.2745, there could be another rally. In the stated case, the pair could rise toward the 1.2800 level or even 1.2840.

On the downside, there is a major support forming near the 50-hour simple moving average at 1.2650. If there is a downside break below the 1.2650 support, the pair could accelerate lower.

The next major support is near the 1.2600 zone, below which the pair could test 1.2550. Any more losses could lead the pair toward the 1.2500 support.

Disclaimer: This publication represents the News of the Companies operating under the FXOpen brand only. It is not to be construed as an offer, solicitation, or recommendation with respect to products and services provided by the Companies operating under the FXOpen brand, nor is it to be considered financial advice.
I trade at FXOpen

Please add www.kreslik.com to your ad blocker white list.
Thank you for your support.


Return to “forex”