A fairly reasonable Friday for me - fairly cautious, patient and working with the SMA bias.
I traded the first down move, netting 1.5-2R on smaller size, so account impact was +1%.
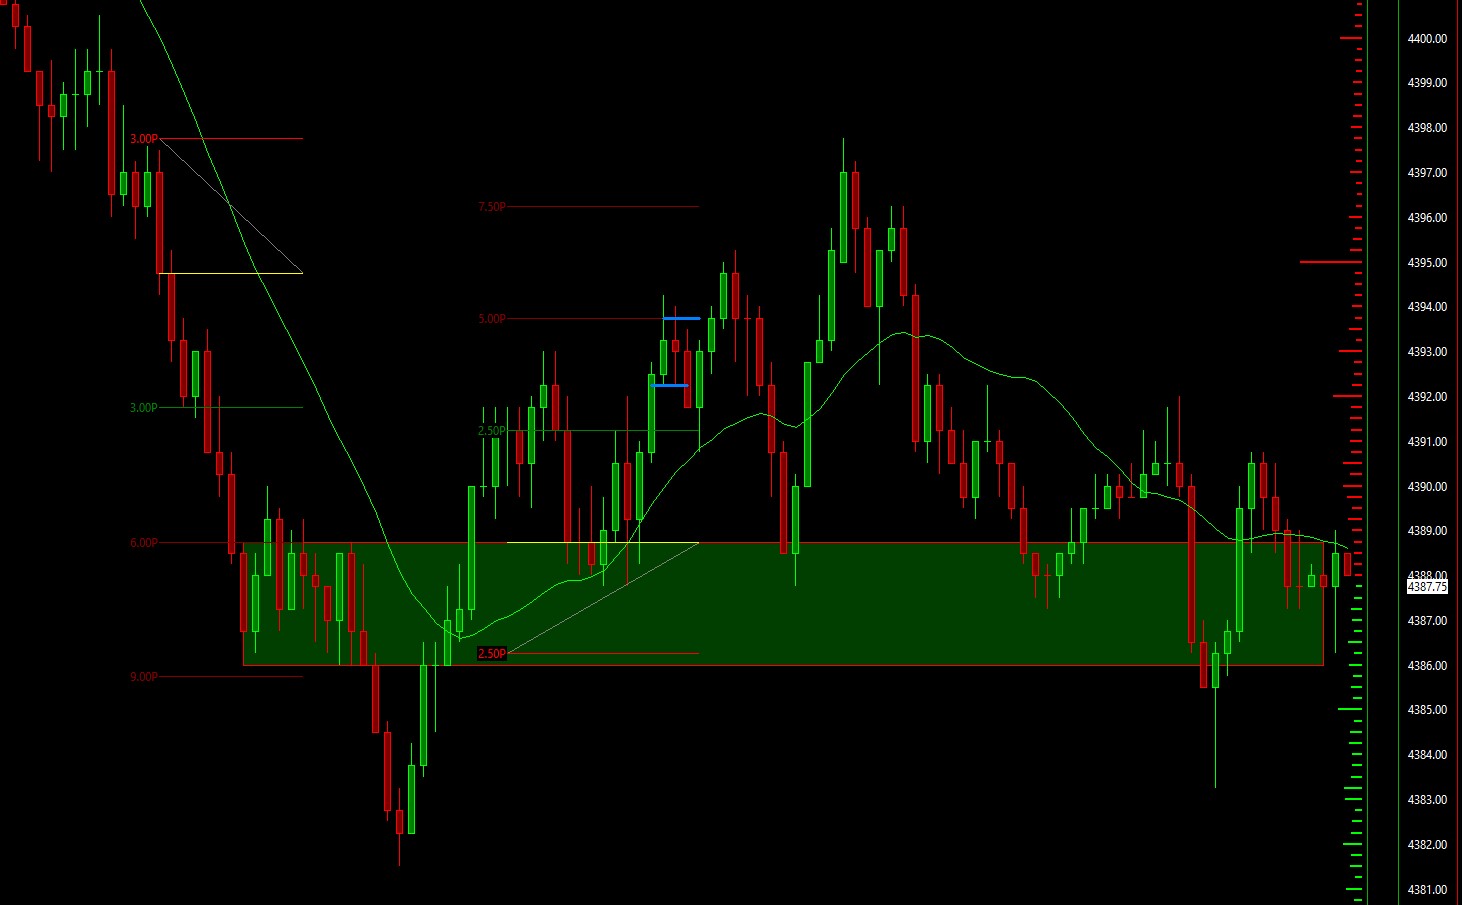
I saw a nice base forming (start of my rectangle) and went long at the lower third area of the rectangle but price moved lower so I was stopped out for -0.25% - I saw this as a breakout to the downside, so I reverse and went short at the open of the bar after the breakout - I held until stopped out at top of the rectangle.
I was looking at the 3hr and wondered whether we would push lower below the lows of several prior candles, so I was looking for 4477 as a target - a reasonable idea, since we were in the area at the time.
In hindsight I should have set the ego aside and accepted that when the reversal green momentum bar closed at the low of the rectangle and then the next bar retraced 50% and then traded back up to the low of the rectangle it was time to scratch the trade.
That put me at -1% for the day.
- 2023-06-24-MES.jpg (127.94 KiB) Viewed 2404 times
I watched, realising that I'd misread the price action but avoiding the temptation to "get involved". Noticing that someone really wanted to sell at 4391 (where price stops dead for 4 candles) I shorted with the idea of shorting into a long trade for the bounce of the rectangle.
That worked and I got long at the fib retrace lines in the middle of the chart.
I held until price stalled (higher blue line) and then closed out when price retraced below a candle low (lower blue line).
That got me to 1.09% for the day.
I keep observing some very good momentum in the 10 minutes before NY 4pm. Today I was cautious - afraid of losing 1% in the last 10 minutes of the session, so I sat aside and watched.
End of week PnL: $7.42, 0.267% up. I recovered from my poor trading day on Weds, which I'm very pleased about.
I think this represents a good start to rewiring my brain: to be patient, to trade the method and to trade with size that is appropriate.
PnL summary - with graphics, lol.
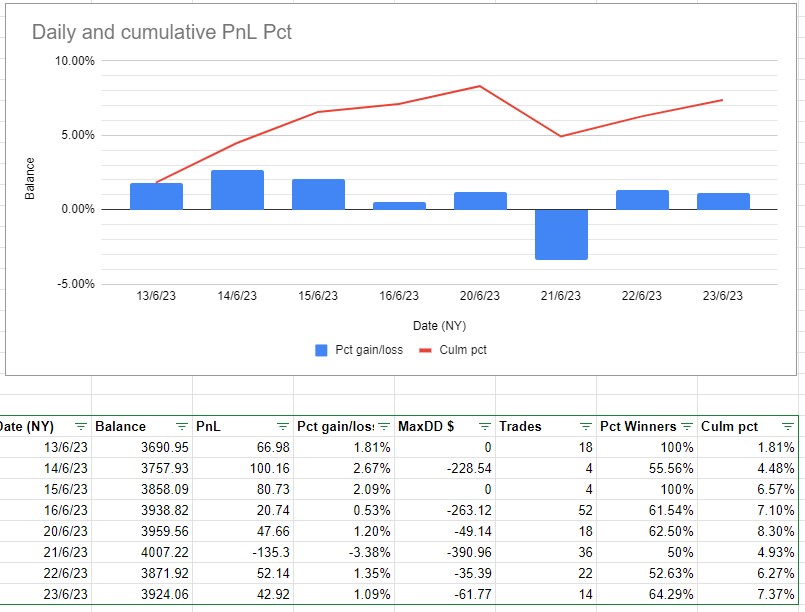
- 2023-06-24-EOW-PnL.jpg (106.21 KiB) Viewed 2404 times
One of the things that is helping me greatly is reading Alias's dead horse thread where the discussion demonstrates that small consistent gains can add up to large absolute value returns. It provides support mentally for when I see crazy high returns from other traders and start to wonder whether I'm actually wasting my time messing around with 0.5% and 1% gains. That confidence converts into belief and that belief converts into actions that help me progress.
The quality of information on Kreslik is great... Happy weekend everyone.


