
Here's a nice opportunity with EU. I highlighted the future 4hr pivot. This is what I mean I use pivots for range purposes. It seems that 8pm - 12am central US time...I'm guessing 9pm - 1am NY time offers a nice idea into the coming London range which fits into the new 4hr candle that will start to form. I've briefly read on here how some people use the Asian range and do some stuff to guess London's and NY range. Maybe this is a different way of seeing it?
I stay away from pairs that moved a lot since the pivot lines will also reflect the large moves, making my stop losses larger taking into account those larger ranges.
Also note that if I'm bullish, I want to buy at the pivot or below. This fits into the previous posts and the numbers the price analyzer shows.
Never Lose Again
Moderator: moderators
-
BambinoFlex
- rank: 500+ posts

- Posts: 557
- Joined: Thu Oct 10, 2019 4:40 am
- Reputation: 336
- Location: Houston
- Real name: Jorge "George" Alvarado
- Gender:

Re: Never Lose Again
- Attachments
-
- FuturePivotsExample.png (18.11 KiB) Viewed 6245 times
"If you're wrong, guess what...thats TRADING"
Please add www.kreslik.com to your ad blocker white list.
Thank you for your support.
Thank you for your support.
-
prochargedmopar

- rank: 10000+ posts

- Posts: 12073
- Joined: Sat Dec 20, 2008 6:07 am
- Reputation: 1790
- Location: Granbury, TX
- Gender:
- Contact:
Re:
MightyOne wrote:es/pip wrote:MightyOne wrote:
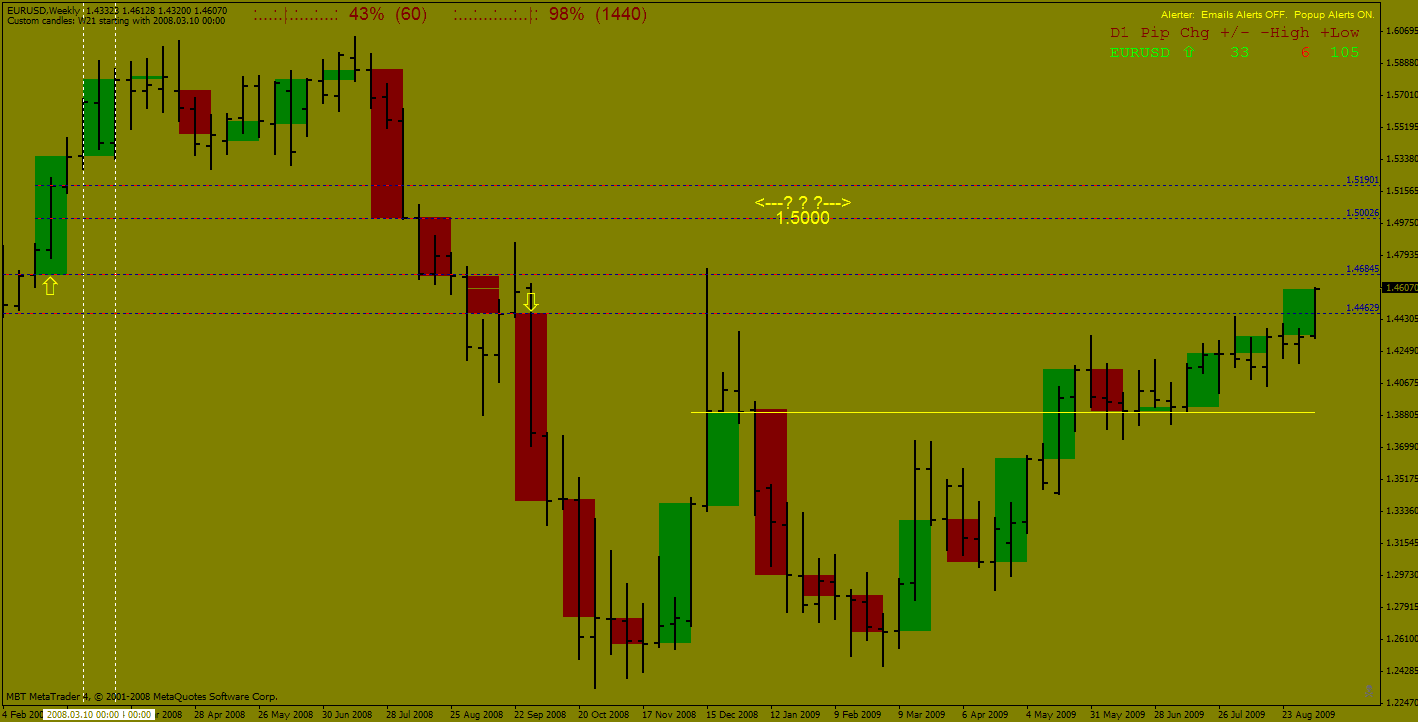
How do you feel about 1.5000?
all warm and fuzzy????????????
lol
not sure?
trying to figure out why you boxed in that zone
i was looking higher based on just what i know
what is that zone based on?
Bottom zone is a M-Lisa style from the opens zone and the top is from the close of the momentum on the base time frame.
This zone applies the support becomes resistance concept:
What you would do is draw a line from the open of a down momo candle and then try and find an up momo candle that places another line as close as possible to the first (creating a zone).
You do the same with the from the close line placement style...
SON OF A BIT$H
I missed that 12 years ago!!!!!!!
#1BODY in direction of profit #2INCREASE lot size Obsessively
My Losses cause me Great Laughter!
Trading Bible here> therumpledone/the-ideas-that-i-trade-by-t3256/page1670
My Losses cause me Great Laughter!
Trading Bible here> therumpledone/the-ideas-that-i-trade-by-t3256/page1670
-
aliassmith

- rank: 5000+ posts

- Posts: 5057
- Joined: Tue Jul 28, 2009 9:50 pm
- Reputation: 2848
- Gender:
Re: Re:
prochargedmopar wrote:MightyOne wrote:es/pip wrote:
all warm and fuzzy????????????
lol
not sure?
trying to figure out why you boxed in that zone
i was looking higher based on just what i know
what is that zone based on?
Bottom zone is a M-Lisa style from the opens zone and the top is from the close of the momentum on the base time frame.
This zone applies the support becomes resistance concept:
What you would do is draw a line from the open of a down momo candle and then try and find an up momo candle that places another line as close as possible to the first (creating a zone).
You do the same with the from the close line placement style...
SON OF A BIT$H
I missed that 12 years ago!!!!!!!
Go back to what you was/are doing. Nothing to see here
Trade Your Way as Long as It Makes Money!
-
prochargedmopar
- rank: 10000+ posts
- Posts: 12073
- Joined: Sat Dec 20, 2008 6:07 am
- Reputation: 1790
- Location: Granbury, TX
- Gender:
- Contact:
Re: Re:
aliassmith wrote:prochargedmopar wrote:MightyOne wrote:
Bottom zone is a M-Lisa style from the opens zone and the top is from the close of the momentum on the base time frame.
This zone applies the support becomes resistance concept:
What you would do is draw a line from the open of a down momo candle and then try and find an up momo candle that places another line as close as possible to the first (creating a zone).
You do the same with the from the close line placement style...
SON OF A BIT$H
I missed that 12 years ago!!!!!!!
Go back to what you was/are doing. Nothing to see here
LOL
I was google searching "Mighty Zone" trying to find out when I first referenced it.
The ZL was defined by ICT as something very close to this.
I see what I see.
It's the STACKING calculator that I'm looking for to make it easier adjust lot size on the fly. WITHOUT THOUGHT.
#1BODY in direction of profit #2INCREASE lot size Obsessively
My Losses cause me Great Laughter!
Trading Bible here> therumpledone/the-ideas-that-i-trade-by-t3256/page1670
My Losses cause me Great Laughter!
Trading Bible here> therumpledone/the-ideas-that-i-trade-by-t3256/page1670
-
LeMercenaire

- rank: 1000+ posts

- Posts: 3184
- Joined: Tue Sep 27, 2016 12:11 am
- Reputation: 2303
- Gender:

Re: Re:
prochargedmopar wrote:MightyOne wrote:es/pip wrote:
all warm and fuzzy????????????
lol
not sure?
trying to figure out why you boxed in that zone
i was looking higher based on just what i know
what is that zone based on?
Bottom zone is a M-Lisa style from the opens zone and the top is from the close of the momentum on the base time frame.
This zone applies the support becomes resistance concept:
What you would do is draw a line from the open of a down momo candle and then try and find an up momo candle that places another line as close as possible to the first (creating a zone).
You do the same with the from the close line placement style...
SON OF A BIT$H
I missed that 12 years ago!!!!!!!
Nice find!!!!
Please add www.kreslik.com to your ad blocker white list.
Thank you for your support.
Thank you for your support.
-
prochargedmopar
- rank: 10000+ posts
- Posts: 12073
- Joined: Sat Dec 20, 2008 6:07 am
- Reputation: 1790
- Location: Granbury, TX
- Gender:
- Contact:
Re:
prochargedmopar wrote:M.O.,
Can we still place our regular trades while waiting on price to move back toward the line?
Also, Once the candle closes can we wait for a couple pip retrace of price to get into the position?
When can we stop out if needed? M15 avg. candle size?
I'll try it out tomorrow morning and when I get back out of bed tomorrow night. I stunk it up today after 5 really good days.
Pro
My very first question after the Challenge was presented.
Wow. no wonder.
](https://www.kreslik.com/forums/images/smilies/eusa_wall.gif "Brick wall")

#1BODY in direction of profit #2INCREASE lot size Obsessively
My Losses cause me Great Laughter!
Trading Bible here> therumpledone/the-ideas-that-i-trade-by-t3256/page1670
My Losses cause me Great Laughter!
Trading Bible here> therumpledone/the-ideas-that-i-trade-by-t3256/page1670
-
prochargedmopar
- rank: 10000+ posts
- Posts: 12073
- Joined: Sat Dec 20, 2008 6:07 am
- Reputation: 1790
- Location: Granbury, TX
- Gender:
- Contact:
Re:
prochargedmopar wrote:MightyOne Challenge
Eur/Jpy line at 117.24 at 5:30pm.
First trade:
B 117.285-117.336 19:15-19:16 = +5.1
Second trade:
S 117.226-117.141 19:21-19:21 +8.5
I will not post any more till the end of the week as not to overload the thread. I had open/diff and tro_modified candle color on my chart but will use the tro-"black" candles only template tomorrow.
I had a bad day this morning trading because I broke a few rules and when I went to bed my wife said:
If you don't follow the rules you'll be a maintenance man for the next 20yrs.
Today when I got up I printed out a sheet of paper and posted it right on the wall in front of my trading desk.
It says;
Not Following Rules=
20 more years as a Maintenance Man
And that right there during Asia was over 2.5 LINES
Sheeesh. What was I (NOT) thinking.
#1BODY in direction of profit #2INCREASE lot size Obsessively
My Losses cause me Great Laughter!
Trading Bible here> therumpledone/the-ideas-that-i-trade-by-t3256/page1670
My Losses cause me Great Laughter!
Trading Bible here> therumpledone/the-ideas-that-i-trade-by-t3256/page1670
-
BambinoFlex
- rank: 500+ posts
- Posts: 557
- Joined: Thu Oct 10, 2019 4:40 am
- Reputation: 336
- Location: Houston
- Real name: Jorge "George" Alvarado
- Gender:
Re: Never Lose Again
Really trying to work the stacking. It's like riding a bicycle. I also finally understand the "pointy things" idea. I was stuck in a mind set of not buying on a down day, and not selling on an up day. Even though I'm aware that price breaking a previous high or low doesn't constitute it closing in that direction for the day (people call it liquidity hunts). Got lucky on UJ, targeting weekly previous low, then weekly S1. Risk is the same as I started. Ended up adding my third position based on the 1-2-3 pattern.
**** Forgot to add ****
Target of previous week low is essentially the Z-line.
**** Forgot to add ****
Target of previous week low is essentially the Z-line.
- Attachments
-
- UJStacking.JPG (125.72 KiB) Viewed 8542 times
"If you're wrong, guess what...thats TRADING"
-
BambinoFlex
- rank: 500+ posts
- Posts: 557
- Joined: Thu Oct 10, 2019 4:40 am
- Reputation: 336
- Location: Houston
- Real name: Jorge "George" Alvarado
- Gender:
Re: Never Lose Again
Anyone has or knows of an indicator similar to this one but that shows your current risk in dollars?
Thank you in advance
Thank you in advance
- Attachments
-
- iExposure.JPG (19.34 KiB) Viewed 8502 times
"If you're wrong, guess what...thats TRADING"
-
BambinoFlex
- rank: 500+ posts
- Posts: 557
- Joined: Thu Oct 10, 2019 4:40 am
- Reputation: 336
- Location: Houston
- Real name: Jorge "George" Alvarado
- Gender:
Re: Never Lose Again
baddog4x wrote:BambinoFlex wrote:Anyone has or knows of an indicator similar to this one but that shows your current risk in dollars? Thank you in advance
chart.png
I don’t see the current open risk in $$.
I’ve seen some that have it in points but I look at risk as $$ not points/pips.
For example:
UJ - 5 positions - total position=1 lot - Total Risk/Stop Loss = $20.03
"If you're wrong, guess what...thats TRADING"
Please add www.kreslik.com to your ad blocker white list.
Thank you for your support.
Thank you for your support.