Postby BambinoFlex » Wed Dec 29, 2021 4:56 am
I mainly use pivots for RANGE purposes. My targets are.
1. Pivot Point (Pivot Fade)
2. S1 OR R1
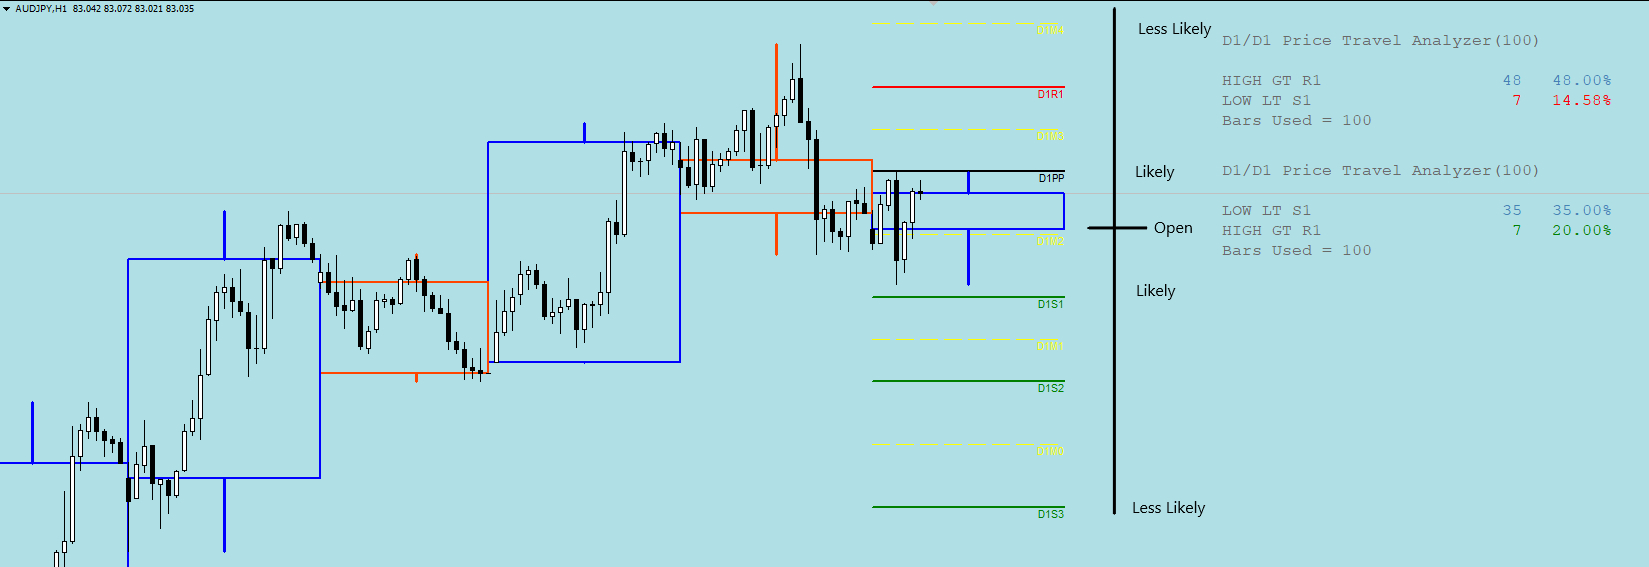
Here's a picture. I should cut the price analyzer out but the main focus is that from the open, price will travel up or down, but certain levels are more likely to be crossed than others. For example. If I open 1 trade a day, and my goal is to be flat at the end of day, I will NOT place my targets at R3 or S3. Those lines do not get crossed as often. I have opted for the S1 or R1, depending on my bias.
The reason I treat pivots to help me know what's "likely" and what's "less likely" is because pivots are DYNAMIC. They are dependent on the previous day/hour/15minute (whatever pivot tf you're using). This is important because no matter market conditions, the pivots will reflect current market conditions.
Using the likely vs less likely idea, I've come to understand MO's explanation of how he views ranges. He did actual candle range studies, but I have gravitated toward pivots as my range study.
Quick note, the example is for day pivots, but you can use 4hr pivots, 1hr pivots, weekly pivots, etc... I focus on Weekly, Daily and the 4hr pivots.
-
Attachments
-
- PivotsAndRange.png (29.43 KiB) Viewed 4357 times
"If you're wrong, guess what...thats TRADING"


