


and nice analysis of course, I'd like to see more
Moderator: moderators


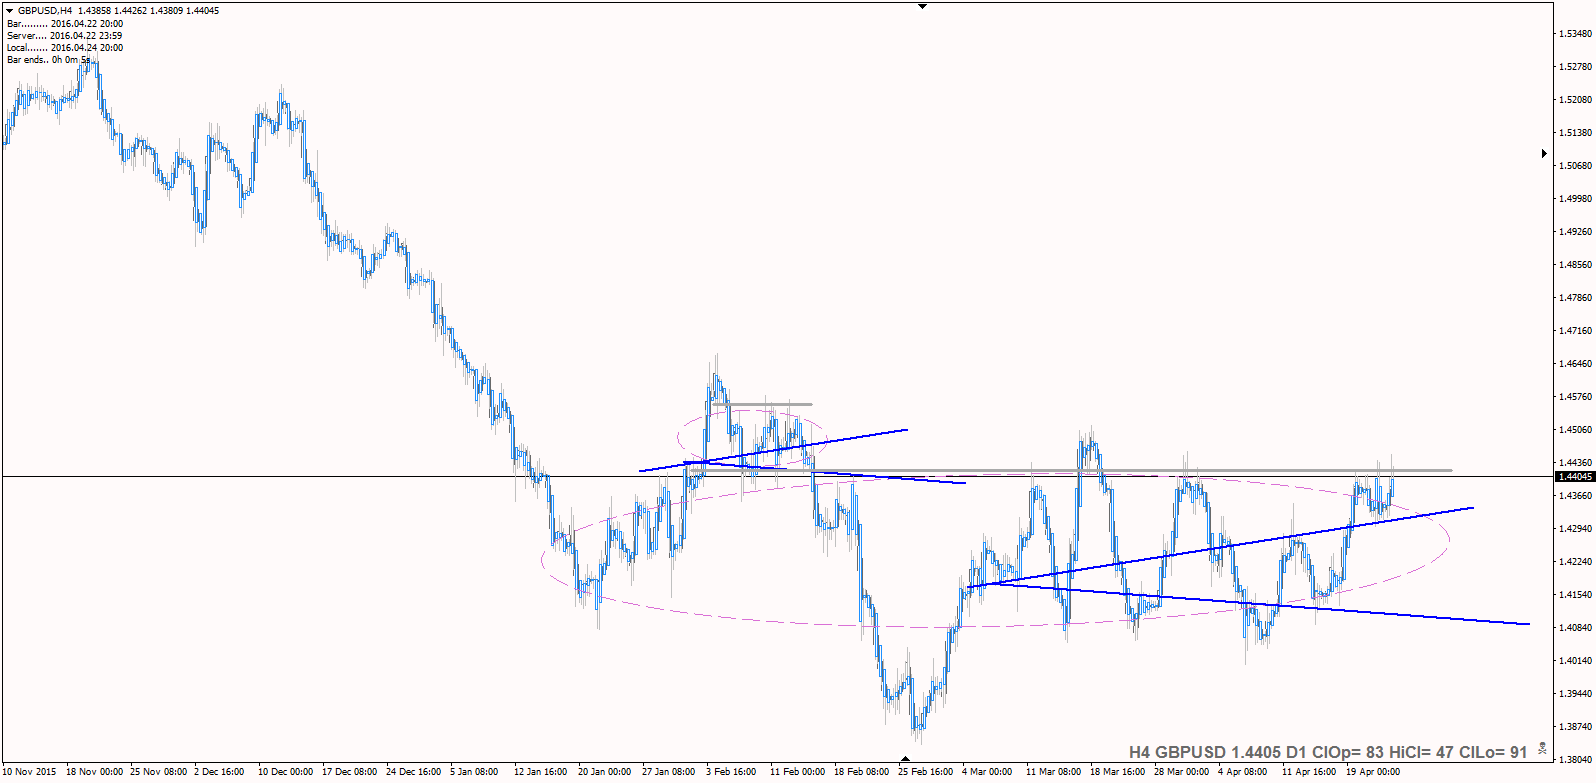


Jalarupa wrote:Thanks for the direction MO
I agree your chart looks way more "believable" than mine...


Jalarupa wrote:Hey Pablo,
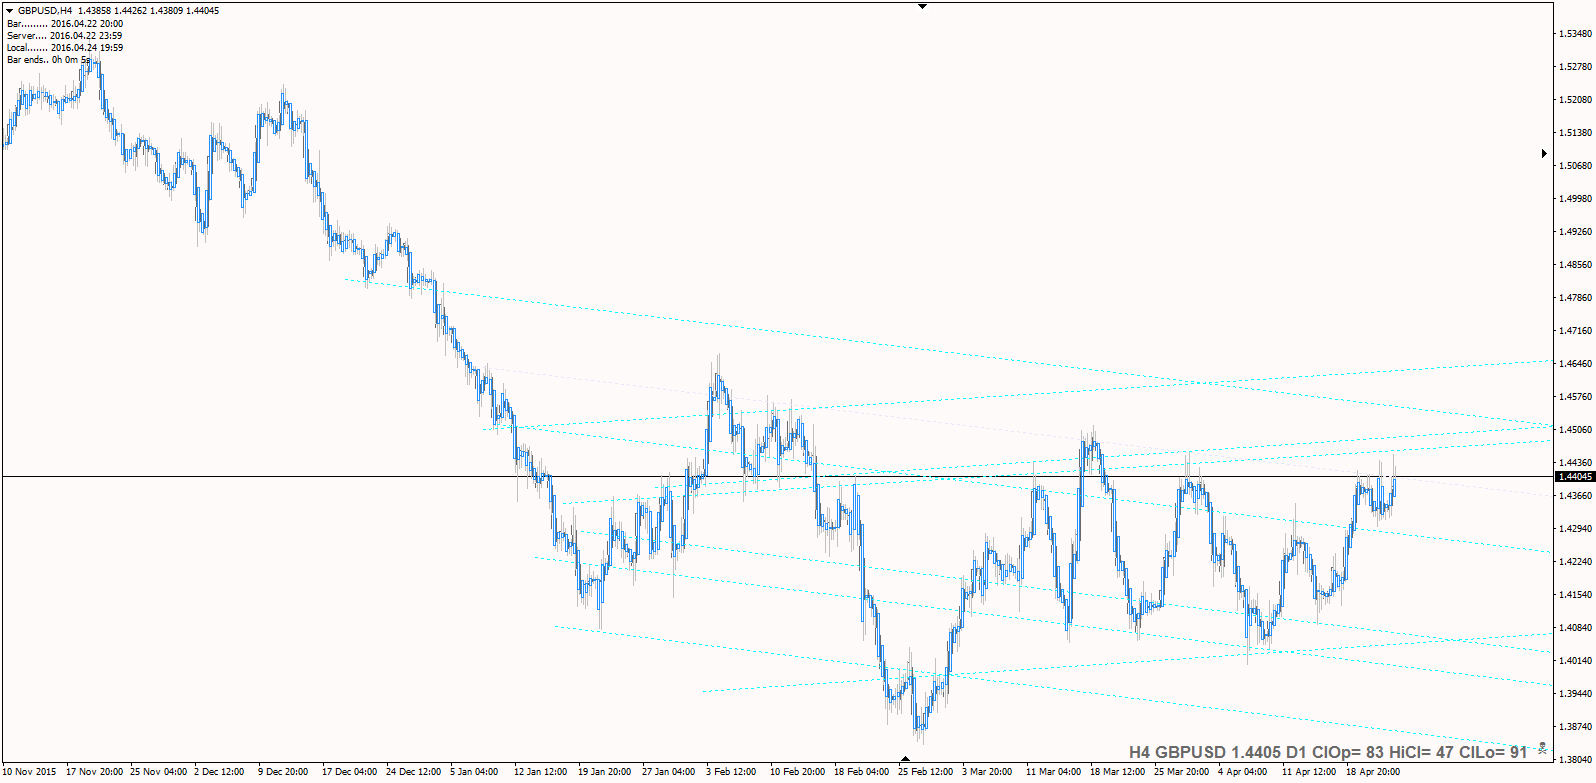
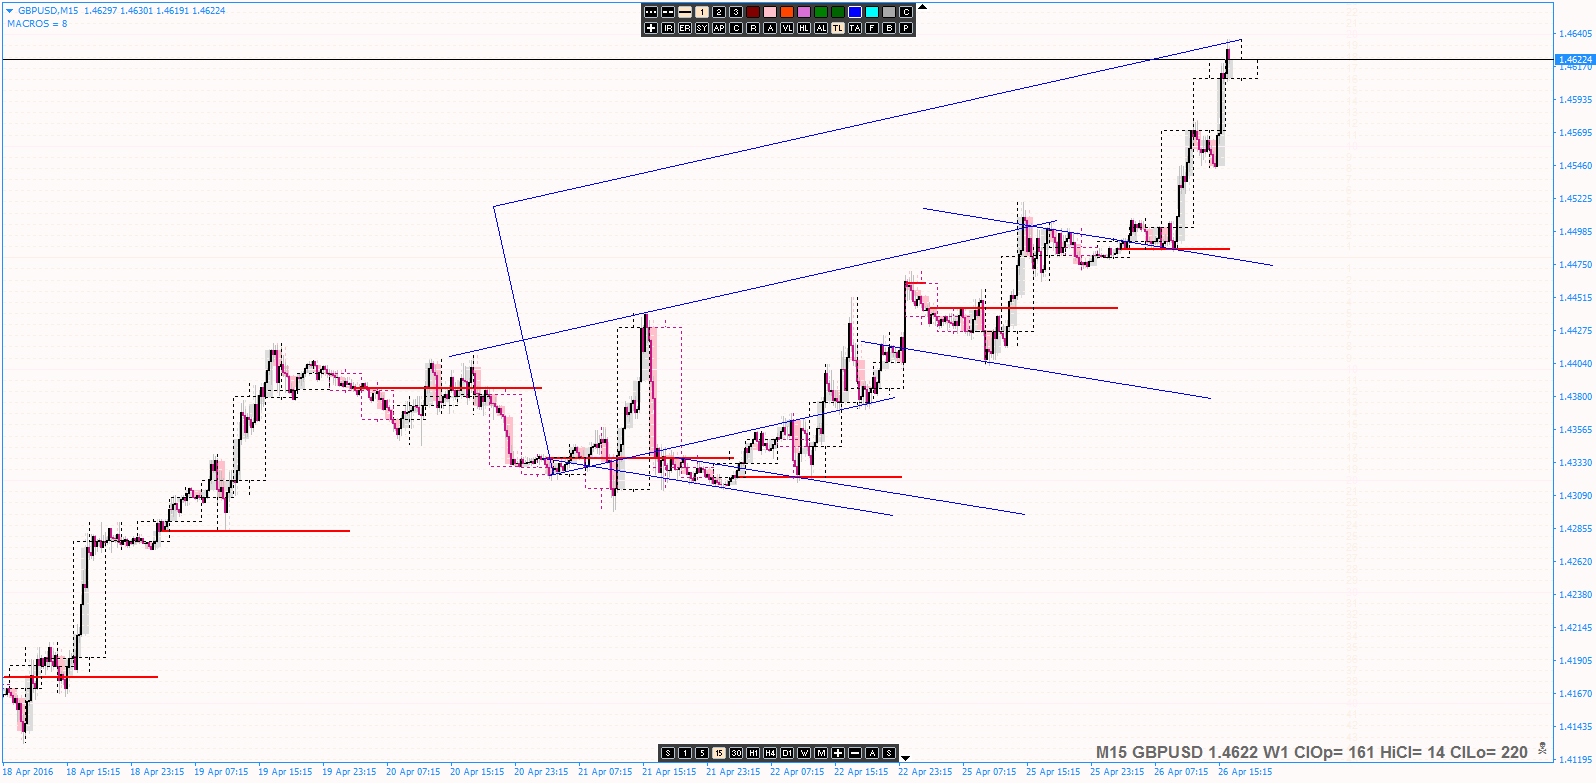
My usage of cones is still something I do, but I find more use out of reading the big picture H4 cones and then trading them... the reality is, after reading my last post... comes need to be used in conjunction with what MO taught... Zlines FAT CAT S/R and MOMO (horizontal lines)...
If you do this on any time frame you can scalp and make money... if you do this on bigger time frames you can position trade and make money and make more money scalping the small moves in between...
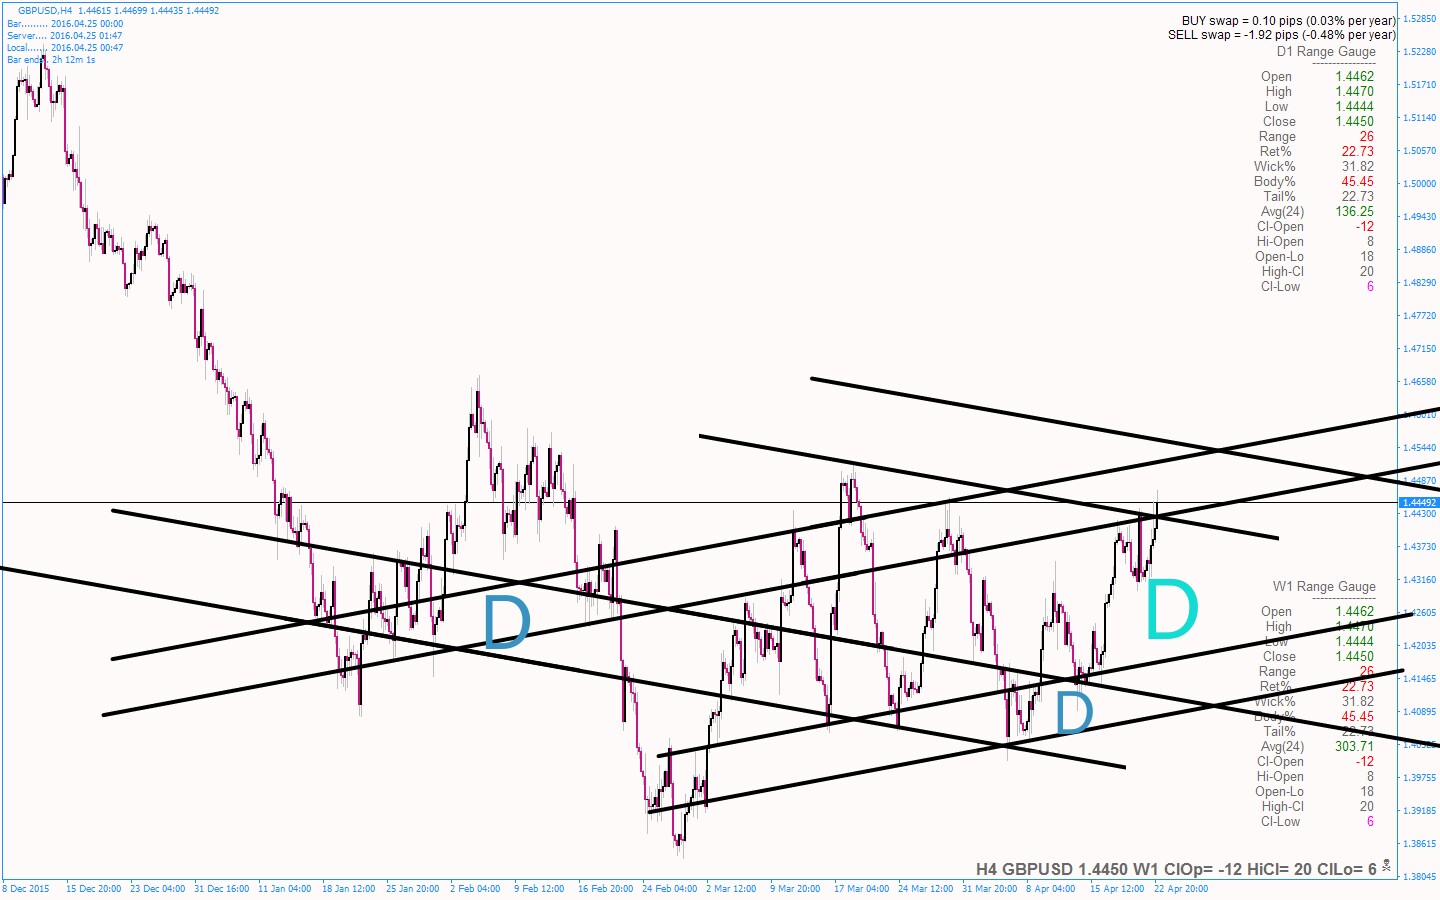
A friend of mine; Newark on this forum uses cones probably in one of the best way I have seen... he uses what MO called a upset and fake outs (stop hunt) to establish the cones tend direction...
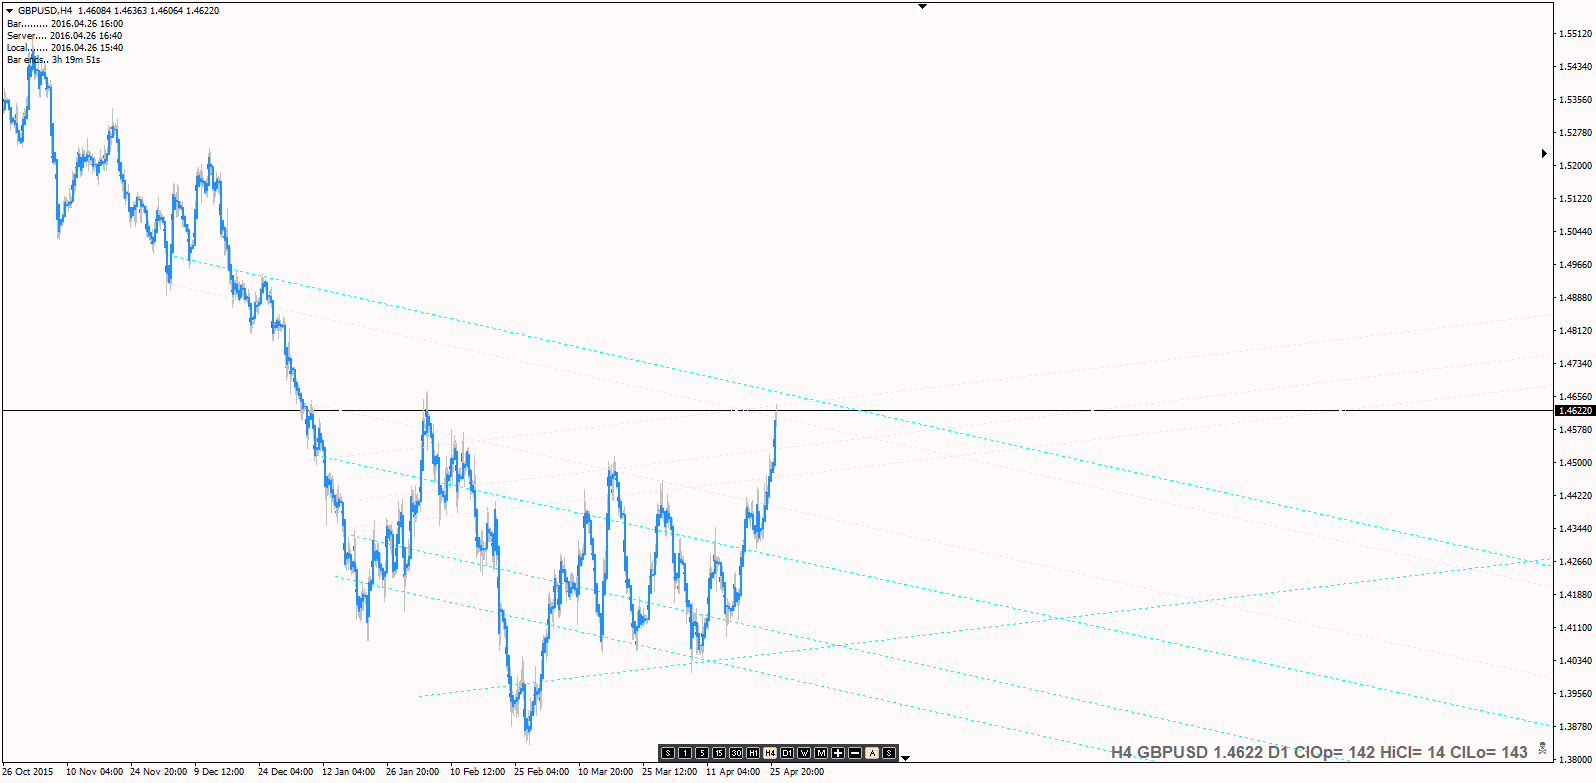
There’s a lot of value in cones, I find most of my success trading them, while applying everything else I have learnt about horizontal lines... I see you do too and that is why you have success in using them...
A cone at an extreme of a range is a fake out or a stop hunt... the opposite trend channel is confirmation of this...

