LeMercenaire wrote:Mira wrote:Thank you Lem!
I'm trying to do the same, back to simplicity

After a time on the web reading about HH/LL i finally accepted that if price broke below a line then it's going down lol.
If i understood right (please guys share your view and correct me if i'm wrong) now we could have different situations but usually two or three important levels will appear:
- the breakout line
- the midpoint (eventually)
- the zero line or origin of momentum
NZDCHFDaily.png
The "problem" is that the more price retraces the bigger the risk that price is closing back over important lines.
In this case a short position became weaker and weaker as price closed past the BO lines (the lower one was a higher high and a 2yr extreme..

)
NZDCHFDaily2.png
For me, on the bottom chart, as soon as I saw that move marked as ''BO Line'' (The lower one), then that would be me looking to get out of any short...
orrrrrrr, hedging back into that move until I was sure it wasn't going to turn, then cutting the short and letting the hedge run).
It's very nice seeing that you're confirming my thoughts, thanks LeM
Do you think that is there a level more powerful than an other? Or that it's just random?
Price holding above the rally's midpoint looks like it's confirming a strong trend, however the origin of the momentum offers monster-entries sometimes

It's also true that sometimes stuff like this happens. I've been in last night, entered in the circle and didn't considered the opposite failed BO (the yellow line called breakout 1).
Considering that i went in on a 15m pattern, my entry was even higher than the H1 zone. Price closed back so i had to kill the trade, then this morning, i woke up and saw this.... lol.
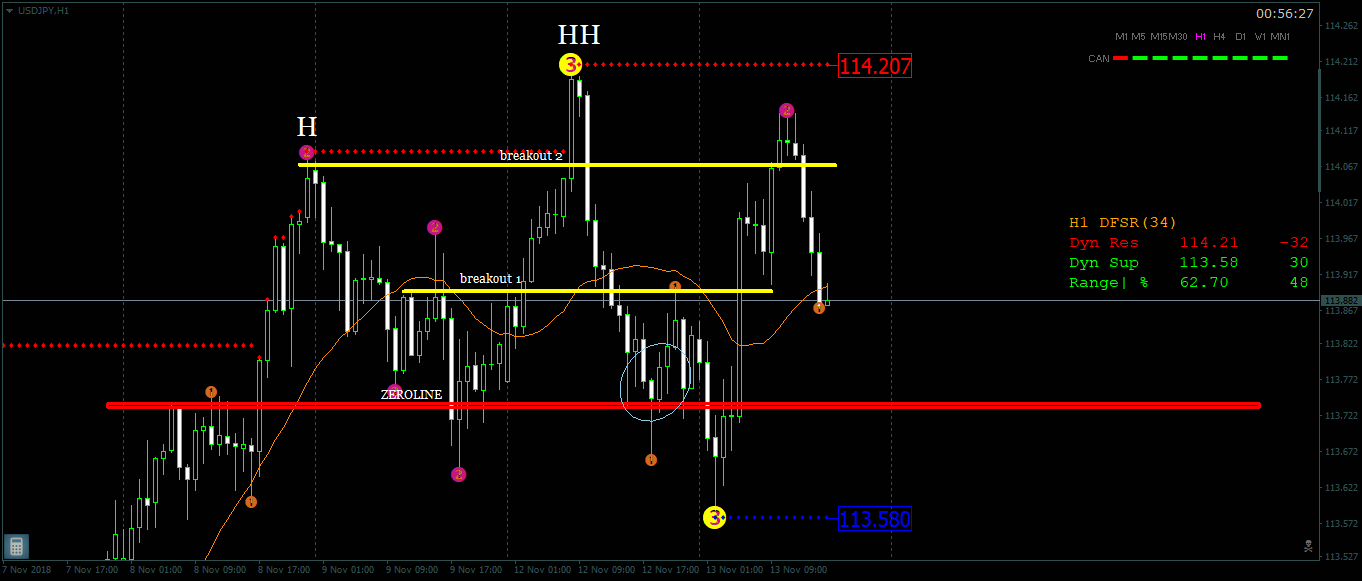
- USDJPYH1.png (47.77 KiB) Viewed 3912 times


 IS A LIE__________