So I have a bunch of questions and idea's I would love to bounce off of you PTG.
What is open/close 1hr line? Just a dragon line (where the candle color changes on the 1hr).
You seem very good at finding places to add on to a trade when it is trending vertically. Myself I'm only able to find add's when price pullbacks into a 1hr momo bar (like dragon has shown). I know that if I were to place trades like that price would immediately retrace, stop me out and then continue in my favor.
Do you have a exit already in mind before you place a trade. I know Dragon always said look at the open, close and 50% area of the next 1hr momo or 4hr. I'm sure you have that in the back of your mind, but you seem to have a more solid exit planned on. I think this could be what allows you to add on when price is moving vertically and not offering any pullbacks.
Do you look for entries more so at multi daily/weekly extremes, then at 4hr/1hr momo 50%, opens like most assume/think is Dragon Style.
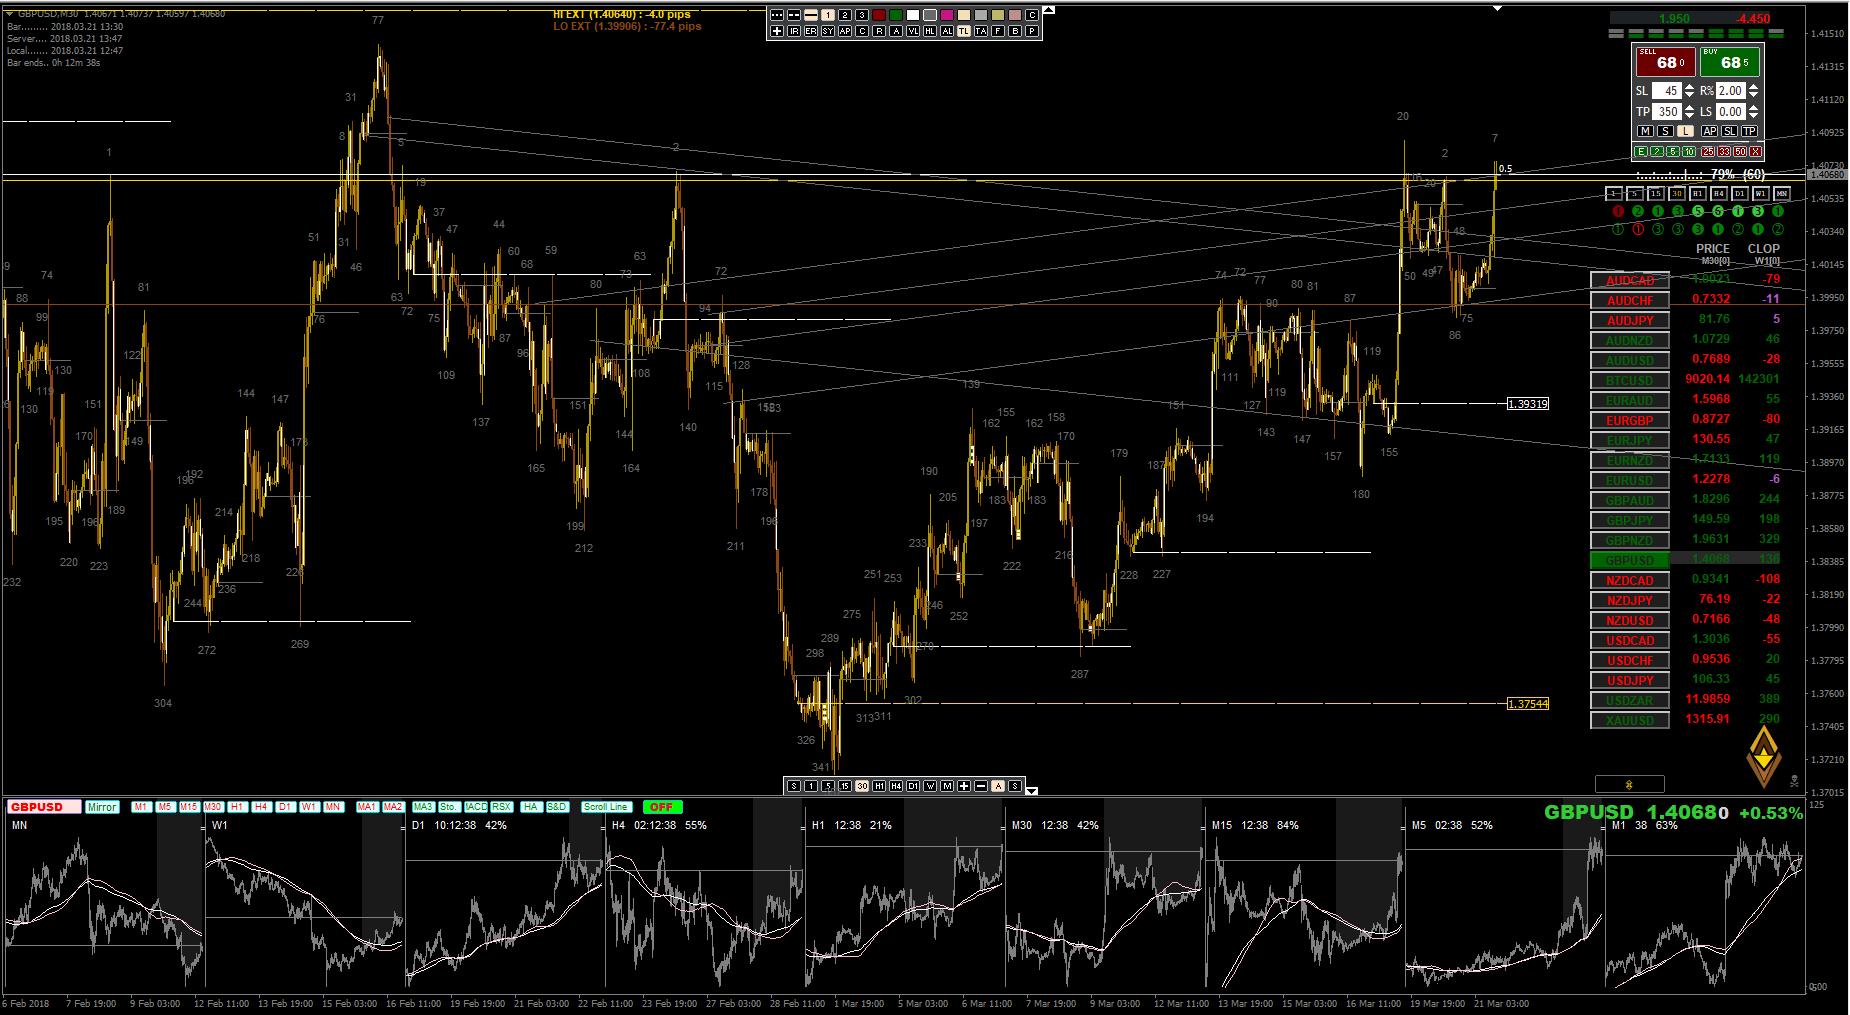
I marked up a chart of yours. To be honest I would have been looking for shorts on this chart as all momo had been to the downside and there was no real reason to go long and hold for so long (at least in my eyes). I feel like this is the type of chart/day that really separates me from the great traders like yourself. Yea I can get the real easy trades and hold for some +100 pip gains here and there. But I know that I would have taken a short were you got long originally. So I would have not only taken a loss but missed the beginning of the trade. Then even if I would have gotten long I wouldn't have had a clear exit to target, so at most I would have held for maybe a 30 pip gain or so. So maybe I would have made 5-10 pips total, while looking at your entries and assuming an exit sometime after your 3rd entry near the extreme, it looks like you made close to 500 pips on those 3 trades. Haha, only a slight difference.
Alright I'll leave it at that and give you a chance to answer before I bomb you with more questions. Thank you for all your help, advice and charts (love them).
Oh also is that an indy you use for the dragon lines? If so can you post it, if its a free one. If not no problem.
The idea's we trade by, so we never lose again. p2. The students become the masters
Moderator: moderators
Re: The idea's we trade by, so we never lose again. p2. The students become the masters
- Attachments
-
- 2018-03-19_1425.png (139.99 KiB) Viewed 3422 times
Please add www.kreslik.com to your ad blocker white list.
Thank you for your support.
Thank you for your support.
Re: The idea's we trade by, so we never lose again. p2. The students become the masters
Jalarupa wrote:There is a very simple and good explanation of trendlines in this book...
http://www.cabafx.com/trading-ebooks-co ... lForex.pdf
But to me it looks like you are going to be fine
Cone high (upper trendine) is resisting price... at the moment a break higher signifies a new leg up...
Thanks Jal for the book. Love the charts, not that I understand them, but maybe one day. Is your use of angles still similar to when you were posting in MO's thread "idea's I trade by" starting around page 112 give or take. You had made some awesome gifs showing how you started drawing your lines and moved them around to find what you were looking for. You also showed how you used the angles to show if price was making a cone or a penennt and then how you used to trade the HTF. It seems at least to me you have taken it to another level.
Now when you talk about the cone high in your post where is that line originally drawn from that you know to use that one to hold price and not another one. There is about a dozen angle lines on your charts and I never really know which line you are talking about or how you drew it in the first place.
Hope all is well for you and wish you an amzing 2018.
Re: The idea's we trade by, so we never lose again. p2. The students become the masters
PTG wrote:Mr. Hyde wrote:Turn TRO's dfsr indy iperiods to 10 instead of 5. Then its like trading S/R with training wheels.
Talking about DFSR, for some reason the name of Lord Tedders popped up in my mind. If I remember correctly, he was on Kreslik when I first came here a whileback. He had a Youtube channel with some interesting ideas; I checked it out and it's still there. 240p resolution only, but that doesn't make it any less worthwhile to watch imo.
This is the channel (I found 4 videos): https://www.youtube.com/user/lordtedders
Video about 3LL scalping strategy using DFSR indi: https://www.youtube.com/watch?v=a4Qs6_-f0iM
Might be helpful for some.
EDIT Kreslik user name is eudamonia
I remember reading posts by eudemonia, way back in the early days of Kreslik. Seemed like a very smart trader to me if I remember correctly. Thanks
Re: The idea's we trade by, so we never lose again. p2. The students become the masters
prochargedmopar wrote:v8power wrote:I markup 400 charts a weekend.
Haha. Im gonna go out on a limb and say that was a period a heavy upper abuse and that post ways probably made with Jack D in his system. He did maybe 80 to 100. Maybe sometimes more but not close to 400. Maybe he was trying to get a point across.
How ya doing Pro.
Re: The idea's we trade by, so we never lose again. p2. The students become the masters
Even tho I didn't trade the 15m charts this week, here are just some examples of triangle's and 3 bar reversal setups. Im really starting to like triangles. Alsot the 3 bar reversal setup is the #2 bar has a lower high and low then bar 1 and 3. We then wait for bar 4 or 5 to break the high of bar 3. We then put a limit order at the halfway point of bar 3 and the sl goes below bars 2.
- gbpjpy-m15-oanda-division1.png (38.93 KiB) Viewed 3416 times
- gbpjpy-m15-oanda-division1.png1.png (31.98 KiB) Viewed 3416 times
Please add www.kreslik.com to your ad blocker white list.
Thank you for your support.
Thank you for your support.


Re: The idea's we trade by, so we never lose again. p2. The students become the masters
Mr. Hyde wrote:So I have a bunch of questions and idea's I would love to bounce off of you PTG.
What is open/close 1hr line? Just a dragon line (where the candle color changes on the 1hr).
You seem very good at finding places to add on to a trade when it is trending vertically. Myself I'm only able to find add's when price pullbacks into a 1hr momo bar (like dragon has shown). I know that if I were to place trades like that price would immediately retrace, stop me out and then continue in my favor.
Do you have a exit already in mind before you place a trade. I know Dragon always said look at the open, close and 50% area of the next 1hr momo or 4hr. I'm sure you have that in the back of your mind, but you seem to have a more solid exit planned on. I think this could be what allows you to add on when price is moving vertically and not offering any pullbacks.
Do you look for entries more so at multi daily/weekly extremes, then at 4hr/1hr momo 50%, opens like most assume/think is Dragon Style.
I marked up a chart of yours. To be honest I would have been looking for shorts on this chart as all momo had been to the downside and there was no real reason to go long and hold for so long (at least in my eyes). I feel like this is the type of chart/day that really separates me from the great traders like yourself. Yea I can get the real easy trades and hold for some +100 pip gains here and there. But I know that I would have taken a short were you got long originally. So I would have not only taken a loss but missed the beginning of the trade. Then even if I would have gotten long I wouldn't have had a clear exit to target, so at most I would have held for maybe a 30 pip gain or so. So maybe I would have made 5-10 pips total, while looking at your entries and assuming an exit sometime after your 3rd entry near the extreme, it looks like you made close to 500 pips on those 3 trades. Haha, only a slight difference.
Alright I'll leave it at that and give you a chance to answer before I bomb you with more questions. Thank you for all your help, advice and charts (love them).
Oh also is that an indy you use for the dragon lines? If so can you post it, if its a free one. If not no problem.
Thanks for looking at it !
Will post complete indicator map tomorrow, if not remind me please. Will post some more thoughts tomorrow; running out of time now.
Posted answers in your screenshot in blue; getting full now..
In short: there was GBP positive news (Brexit deal with EU). S/R won't work until price is extended; that will play out in due course. Because of the news, which appears to be known upfront to some but was otherwise unexpected, the tide has turned; shorts giving up and new longs flowing in. That is a train, don't catch it in your eye trying to go against it.
To be continued.
First screenshot external, file too big https://www.screencast.com/t/P8Myw2yj
- 2018-04-01_0008.png (111.02 KiB) Viewed 3387 times
- 2018-04-01_0012.png (85.28 KiB) Viewed 3387 times
There's no business like [strike]show[/strike] covid19 business.
Re: The idea's we trade by, so we never lose again. p2. The students become the masters
PTG wrote:Mr. Hyde wrote:So I have a bunch of questions and idea's I would love to bounce off of you PTG.
What is open/close 1hr line? Just a dragon line (where the candle color changes on the 1hr).
You seem very good at finding places to add on to a trade when it is trending vertically. Myself I'm only able to find add's when price pullbacks into a 1hr momo bar (like dragon has shown). I know that if I were to place trades like that price would immediately retrace, stop me out and then continue in my favor.
Do you have a exit already in mind before you place a trade. I know Dragon always said look at the open, close and 50% area of the next 1hr momo or 4hr. I'm sure you have that in the back of your mind, but you seem to have a more solid exit planned on. I think this could be what allows you to add on when price is moving vertically and not offering any pullbacks.
Do you look for entries more so at multi daily/weekly extremes, then at 4hr/1hr momo 50%, opens like most assume/think is Dragon Style.
I marked up a chart of yours. To be honest I would have been looking for shorts on this chart as all momo had been to the downside and there was no real reason to go long and hold for so long (at least in my eyes). I feel like this is the type of chart/day that really separates me from the great traders like yourself. Yea I can get the real easy trades and hold for some +100 pip gains here and there. But I know that I would have taken a short were you got long originally. So I would have not only taken a loss but missed the beginning of the trade. Then even if I would have gotten long I wouldn't have had a clear exit to target, so at most I would have held for maybe a 30 pip gain or so. So maybe I would have made 5-10 pips total, while looking at your entries and assuming an exit sometime after your 3rd entry near the extreme, it looks like you made close to 500 pips on those 3 trades. Haha, only a slight difference.
Alright I'll leave it at that and give you a chance to answer before I bomb you with more questions. Thank you for all your help, advice and charts (love them).
Oh also is that an indy you use for the dragon lines? If so can you post it, if its a free one. If not no problem.
Thanks for looking at it !
Will post complete indicator map tomorrow, if not remind me please. Will post some more thoughts tomorrow; running out of time now.
Posted answers in your screenshot in blue; getting full now..
In short: there was GBP positive news (Brexit deal with EU). S/R won't work until price is extended; that will play out in due course. Because of the news, which appears to be known upfront to some but was otherwise unexpected, the tide has turned; shorts giving up and new longs flowing in. That is a train, don't catch it in your eye trying to go against it.
To be continued.
First screenshot external, file too big https://www.screencast.com/t/P8Myw2yj
2018-04-01_0008.png
2018-04-01_0012.png
Damn, thanks for the awesome mark ups and explanations.
2 dumb questions for ya. What is BRN short for and what is the "distal side".
Thanks again.
Re: The idea's we trade by, so we never lose again. p2. The students become the masters
Mr. Hyde wrote:PTG wrote:Mr. Hyde wrote:So I have a bunch of questions and idea's I would love to bounce off of you PTG.
What is open/close 1hr line? Just a dragon line (where the candle color changes on the 1hr).
You seem very good at finding places to add on to a trade when it is trending vertically. Myself I'm only able to find add's when price pullbacks into a 1hr momo bar (like dragon has shown). I know that if I were to place trades like that price would immediately retrace, stop me out and then continue in my favor.
Do you have a exit already in mind before you place a trade. I know Dragon always said look at the open, close and 50% area of the next 1hr momo or 4hr. I'm sure you have that in the back of your mind, but you seem to have a more solid exit planned on. I think this could be what allows you to add on when price is moving vertically and not offering any pullbacks.
Do you look for entries more so at multi daily/weekly extremes, then at 4hr/1hr momo 50%, opens like most assume/think is Dragon Style.
I marked up a chart of yours. To be honest I would have been looking for shorts on this chart as all momo had been to the downside and there was no real reason to go long and hold for so long (at least in my eyes). I feel like this is the type of chart/day that really separates me from the great traders like yourself. Yea I can get the real easy trades and hold for some +100 pip gains here and there. But I know that I would have taken a short were you got long originally. So I would have not only taken a loss but missed the beginning of the trade. Then even if I would have gotten long I wouldn't have had a clear exit to target, so at most I would have held for maybe a 30 pip gain or so. So maybe I would have made 5-10 pips total, while looking at your entries and assuming an exit sometime after your 3rd entry near the extreme, it looks like you made close to 500 pips on those 3 trades. Haha, only a slight difference.
Alright I'll leave it at that and give you a chance to answer before I bomb you with more questions. Thank you for all your help, advice and charts (love them).
Oh also is that an indy you use for the dragon lines? If so can you post it, if its a free one. If not no problem.
Thanks for looking at it !
Will post complete indicator map tomorrow, if not remind me please. Will post some more thoughts tomorrow; running out of time now.
Posted answers in your screenshot in blue; getting full now..
In short: there was GBP positive news (Brexit deal with EU). S/R won't work until price is extended; that will play out in due course. Because of the news, which appears to be known upfront to some but was otherwise unexpected, the tide has turned; shorts giving up and new longs flowing in. That is a train, don't catch it in your eye trying to go against it.
To be continued.
First screenshot external, file too big https://www.screencast.com/t/P8Myw2yj
2018-04-01_0008.png
2018-04-01_0012.png
Damn, thanks for the awesome mark ups and explanations.
2 dumb questions for ya. What is BRN short for and what is the "distal side".
Thanks again.
BRN = Big Round Number e.g. 106.000 1.2400
Distal side is towards the outer side of the chart
There's no business like [strike]show[/strike] covid19 business.
-
Jalarupa

- rank: 1000+ posts

- Posts: 1300
- Joined: Tue Feb 23, 2010 5:50 pm
- Reputation: 324
- Location: South Africa
- Gender:

Re: The idea's we trade by, so we never lose again. p2. The students become the masters
Mr. Hyde wrote:Jalarupa wrote:There is a very simple and good explanation of trendlines in this book...
http://www.cabafx.com/trading-ebooks-co ... lForex.pdf
But to me it looks like you are going to be fine
Cone high (upper trendine) is resisting price... at the moment a break higher signifies a new leg up...
Thanks Jal for the book. Love the charts, not that I understand them, but maybe one day. Is your use of angles still similar to when you were posting in MO's thread "idea's I trade by" starting around page 112 give or take. You had made some awesome gifs showing how you started drawing your lines and moved them around to find what you were looking for. You also showed how you used the angles to show if price was making a cone or a penennt and then how you used to trade the HTF. It seems at least to me you have taken it to another level.
Now when you talk about the cone high in your post where is that line originally drawn from that you know to use that one to hold price and not another one. There is about a dozen angle lines on your charts and I never really know which line you are talking about or how you drew it in the first place.
Hope all is well for you and wish you an amzing 2018.
No it's simpler than what you think...
Cone high is the cone where current prices was hitting up against...
It got broken and there was another leg up...
Simple breakout pullback (zline) and continuation in the direction of the breakout...

Re: The idea's we trade by, so we never lose again. p2. The students become the masters
Nice possible setup
- Attachments
-
- gbpjpy-d1-fx-choice-limited.png (47.33 KiB) Viewed 3250 times
Please add www.kreslik.com to your ad blocker white list.
Thank you for your support.
Thank you for your support.