PhilipLangford wrote:Trying out Dragon Style.
I'm hooked. There's no turning back. The fib tool is an H4 candle off a number 3 sema.
Turns out I chose a good exit because that long M15 bar just got zeroed hard.
Moderator: moderators


PhilipLangford wrote:Trying out Dragon Style.
I'm hooked. There's no turning back. The fib tool is an H4 candle off a number 3 sema.
PhilipLangford wrote:Mr. Hyde wrote:Picture says it all.
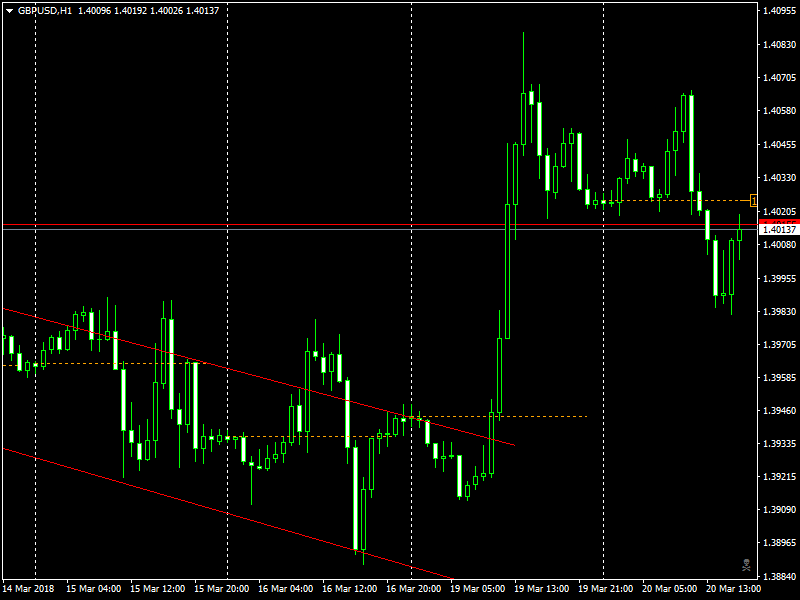
What is a downtrend. 2 lower lowers and 2 lower highers. Then you have a 1hr momo bar that no other 1hr momo bar can close above its 50% area. So we.....Sell. Then we look to exit at a BO were traders moved their SL to breakeven. Rinse and repeat.
Here's that downtrend between the two trendlines.
According to price action, GU was heading south as brilliantly analyzed by Mr.Hyde.
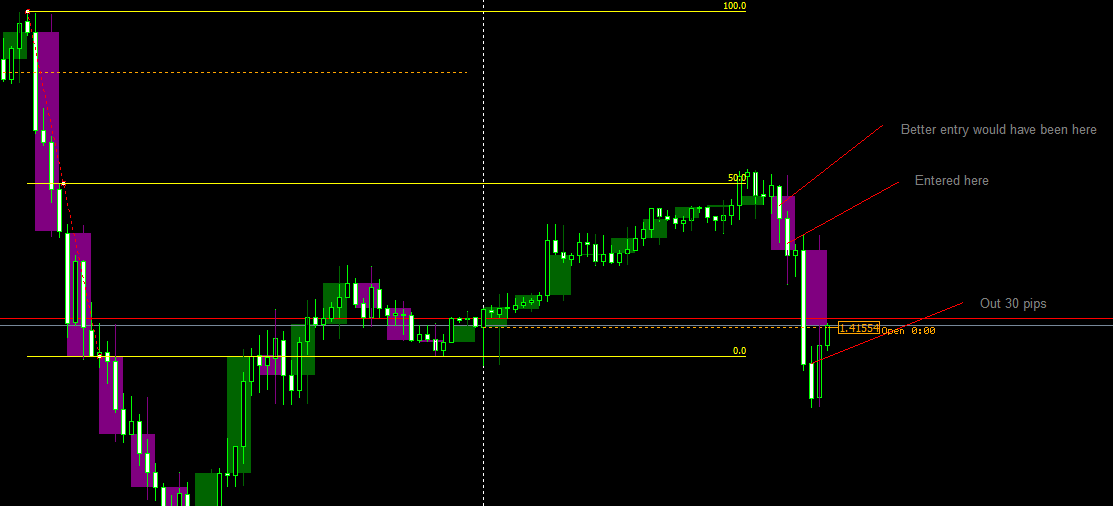
Then suddenly there was news about progress in Brexit negotiations which nullified the analysis and gave strong upward momentum.
We can now see traders getting zlined left and right.
This is not to take away from the methods of Mr.Hyde, which are massively valuable, just to highlight the fact that news events
can and do shove the markets around. Why not just wait around for news, see what the market does, then trade with that generated momentum?
There ought to be several high probability trades a week doing this.
Edit: quote
Jalarupa wrote:Mr. Hyde wrote:Picture says it all.
What is a downtrend. 2 lower lowers and 2 lower highers. Then you have a 1hr momo bar that no other 1hr momo bar can close above its 50% area. So we.....Sell. Then we look to exit at a BO were traders moved their SL to breakeven. Rinse and repeat.
download/file.php?id=23448
I have no right to post anymore as I do not follow any of these threads...
BUT I feel like this is something that may be worthwhile to some...?
Price enters the cone... Price exits the cone... follow Price...
Mr. Hyde wrote:Still bearish on EU. Warning lines kept price within the ML. Possible triangle setup then looked where the possible measured move would put the exit at and looked for some confluence. The red price tag is possible entry you could look for using the daily chart and the 3 bar reversal pattern.
eurusd-d1-fx-choice-limited.png
PTG wrote:Mr. Hyde wrote:Still bearish on EU. Warning lines kept price within the ML. Possible triangle setup then looked where the possible measured move would put the exit at and looked for some confluence. The red price tag is possible entry you could look for using the daily chart and the 3 bar reversal pattern.
eurusd-d1-fx-choice-limited.png
Stuck in the middle of a range, but it is contracting (and that shows nicely in your picture).
I have no bias, merely scenarios
2018-03-31_1114.png
PhilipLangford wrote:PhilipLangford wrote:Trying out Dragon Style.
I'm hooked. There's no turning back. The fib tool is an H4 candle off a number 3 sema.
Turns out I chose a good exit because that long M15 bar just got zeroed hard.
Mr. Hyde wrote:PTG wrote:Mr. Hyde wrote:Still bearish on EU. Warning lines kept price within the ML. Possible triangle setup then looked where the possible measured move would put the exit at and looked for some confluence. The red price tag is possible entry you could look for using the daily chart and the 3 bar reversal pattern.
eurusd-d1-fx-choice-limited.png
Stuck in the middle of a range, but it is contracting (and that shows nicely in your picture).
I have no bias, merely scenarios
2018-03-31_1114.png
PTG and my post show a perfect example of a veteran trader and a newbie. Even though I new EU was in a range and had drawn a box around it, I choose to ignore it. I also knew that price was showing no bias as to which way it would go (as PTG pointed out), but yet I still was looking for bearish reason to go short. Why is that some may ask? Probably because price "had" formed such nice bearish setup's that I look for and love. The key word is had and price has not followed through as it should have normally on the trades that worked for me in the past. So a good trader should have wiped his mental slate clean and started from a point of openness.
So lets do that now. Price is in a triangle and for that reason it could go up or down. Now I have a ML drawn with price having hit the warning line and respecting it. Also it formed a 3 bar reversal pattern that I like and if price makes it to the red price tag I will enter a small position. If price then reverses from that area and begins to move down I will look at adding at the break of the triangle and other possible spots that could present themselves as price continues to print bars. But if it blows through that area the sl for that position will be the previous high which also would be the break of the upper triangle line. If that happens then I will look for reasons to buy if there are any.
Thank you PTG for your post. Not only was it a wake up call for me, it shows other members the proper way to look at price.