How to be a MOnster

free & uncensored discussion arena for TheRumpledOne

Moderator: moderators

User avatar
MightyOne
rank: 5000+ posts
rank: 5000+ posts
Posts: 6055
Joined: Wed Dec 10, 2008 6:33 pm
Reputation: 560
Gender: Male

Re: How to be a MOnster

Postby MightyOne » Fri Sep 01, 2017 3:18 pm

My preferred level of risk is 2 lines, although it can be as small as 1 line if sized to the weekly or monthly chart.

The BuyZone is called the Buy7one to distinguish it from static zones which use 8 or 10 pips for every pair.

A 'line' is a segment of price range and you can think of a line as if it were a pip.

A Buy7one is two lines joined together to create a zone where as SweetSpotsGOLD is price closing between and breaking out of a 'line'; if you use closing prices to plot a P&F chart then you are trading SSG.
We know that the more H1 lines we string together the larger the chart that is being traded, so you could say that SSG is simply the next smallest chart or if you are already trading H1- then it is an M1 to M5 chart trade (there is no size adjustment between M1 and H1, you would just watch the charts for exits).

The line that is outside of the Buy7one I'll call the 'Buy7one Shadow' & it is simply what the Buy7one would look like without 'my is trigger' set to true; it is also used as a take partial profit line. I prefer 'my is' because I think of a close as a pattern and a wick as a breakout: if I enter after price moves away from the open then I am entering after a 'break' to higher(?) prices.

I'll use the BZS when it appears that price is not interested in the BZ.

EURJPYM30.png
EURJPYM30.png (53.12 KiB) Viewed 3140 times

Please add www.kreslik.com to your ad blocker white list.
Thank you for your support.

User avatar
Mira
rank: 1000+ posts
rank: 1000+ posts
Posts: 1729
Joined: Thu Nov 10, 2016 8:37 pm
Reputation: 1608
Gender: None specified
Contact:

Re: How to be a MOnster

Postby Mira » Sat Sep 02, 2017 1:26 pm

I still don't understand how to recognize when a price level around the midpoint is going to "hold".

Yes, price has to move away.. but when?

IMG_1360.PNG
IMG_1360.PNG (68.4 KiB) Viewed 3087 times
__________ THE :smt096 IS A LIE__________

User avatar
MightyOne
rank: 5000+ posts
rank: 5000+ posts
Posts: 6055
Joined: Wed Dec 10, 2008 6:33 pm
Reputation: 560
Gender: Male

Postby MightyOne » Sat Sep 02, 2017 5:20 pm

You know what you should do, you know :lol:

EURJPYDaily.png
EURJPYDaily.png (63.56 KiB) Viewed 3249 times

User avatar
Jalarupa
rank: 1000+ posts
rank: 1000+ posts
Posts: 1300
Joined: Tue Feb 23, 2010 5:50 pm
Reputation: 324
Location: South Africa
Gender: None specified

Re: How to be a MOnster

Postby Jalarupa » Sat Sep 02, 2017 5:37 pm

LOL - Yeah and every now and then you have a brain fart and think its going to somehow work out for you...

MO you *censored - swear word* legend! Thank you! This FX journey has been great so far!
:smt065

User avatar
Mira
rank: 1000+ posts
rank: 1000+ posts
Posts: 1729
Joined: Thu Nov 10, 2016 8:37 pm
Reputation: 1608
Gender: None specified
Contact:

Re: How to be a MOnster

Postby Mira » Tue Sep 05, 2017 9:03 am

I didn't want to quote everybody :lol:

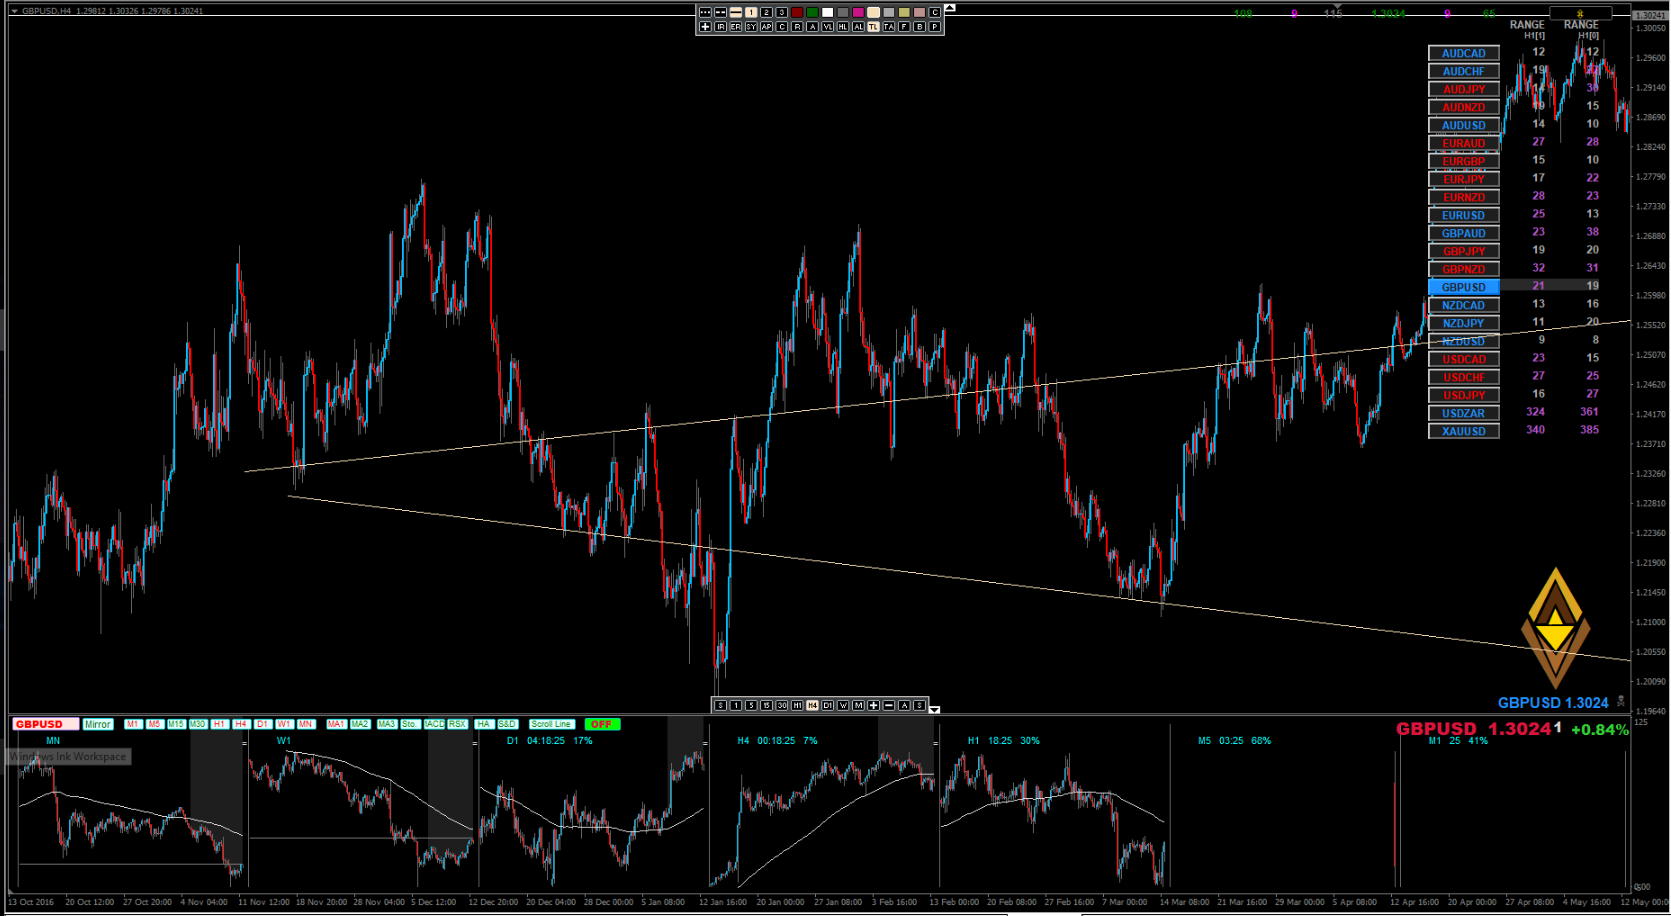
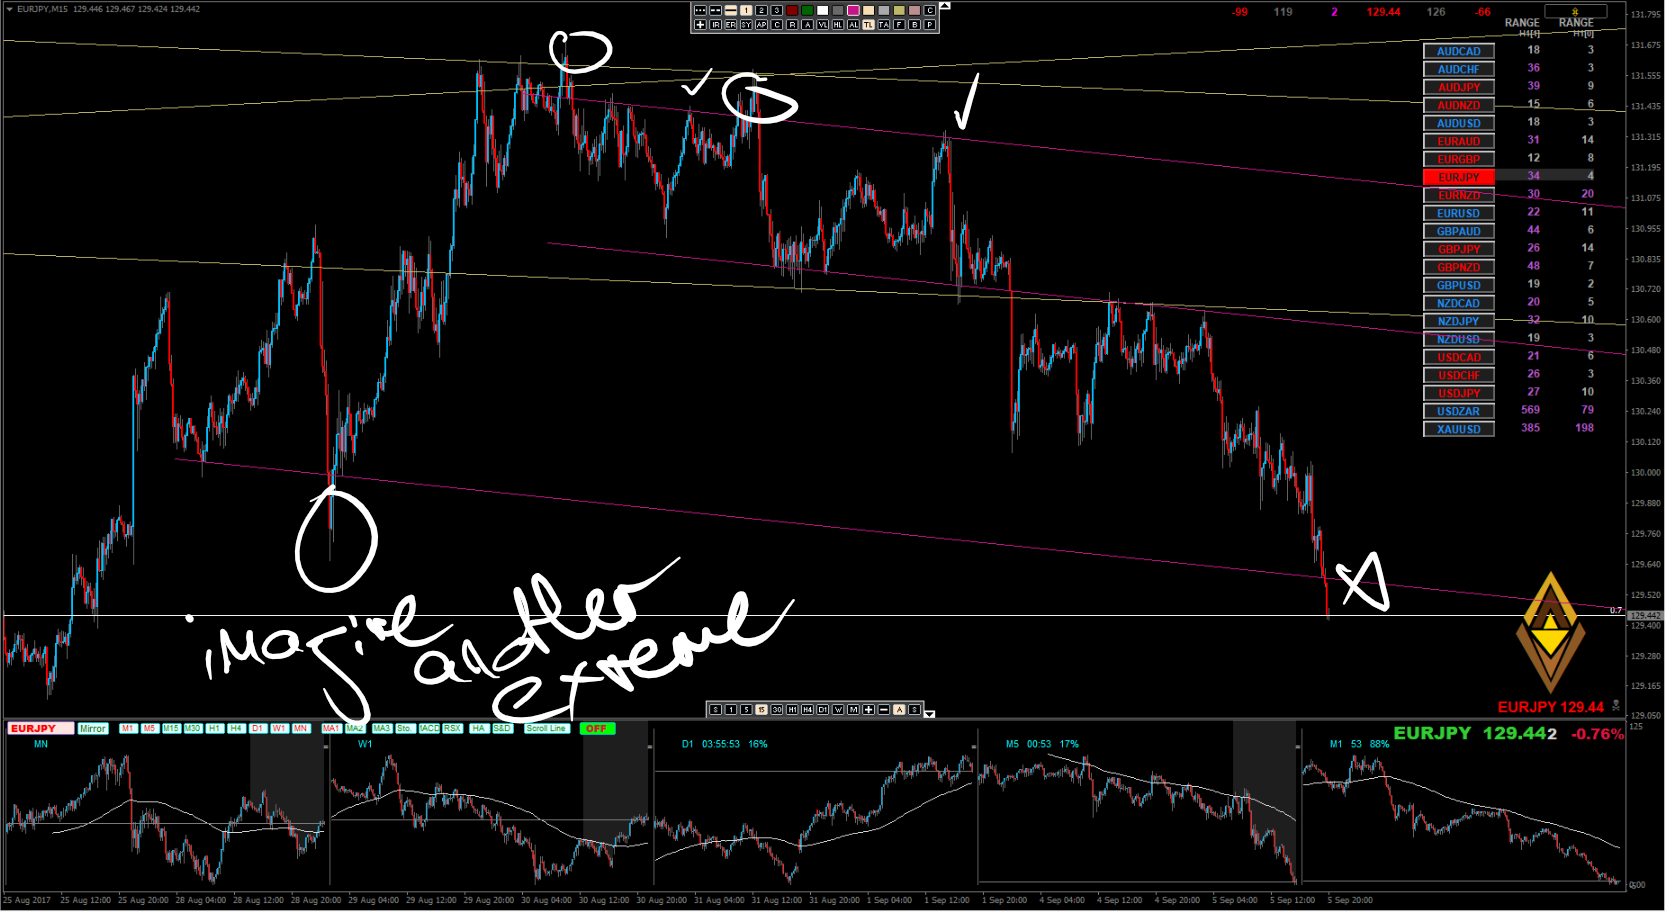
I'm making this post because I was wondering if a D1 extreme is there on a H1 chart too.
If price closes over that line on a smaller timeframe then I'm going to "follow" the momentum, chart period after chart period.


quote="dojirock"

That picture that I re-posted hits it on the head. Sometimes 'old' momentum is only a few bars back on turns. Sometimes 'old' momentum is 30 bars back ONLY due to price was in a strong up trend or down trend. With that perspective are not those 30 bars all in one of a higher time frame? If so, using the logic of "It takes momentum to break momentum", has that happened yet on that time frame? or not?
Not to confuse, but its all the same on any time frame, chart, and or chart type. Once you learn to read momentum. Its the essence of price action.

doji[/quote]


quote="MightyOne"

I keep saying "don't read old posts, they are just going to confuse you when you read the new posts" but people do it anyway.

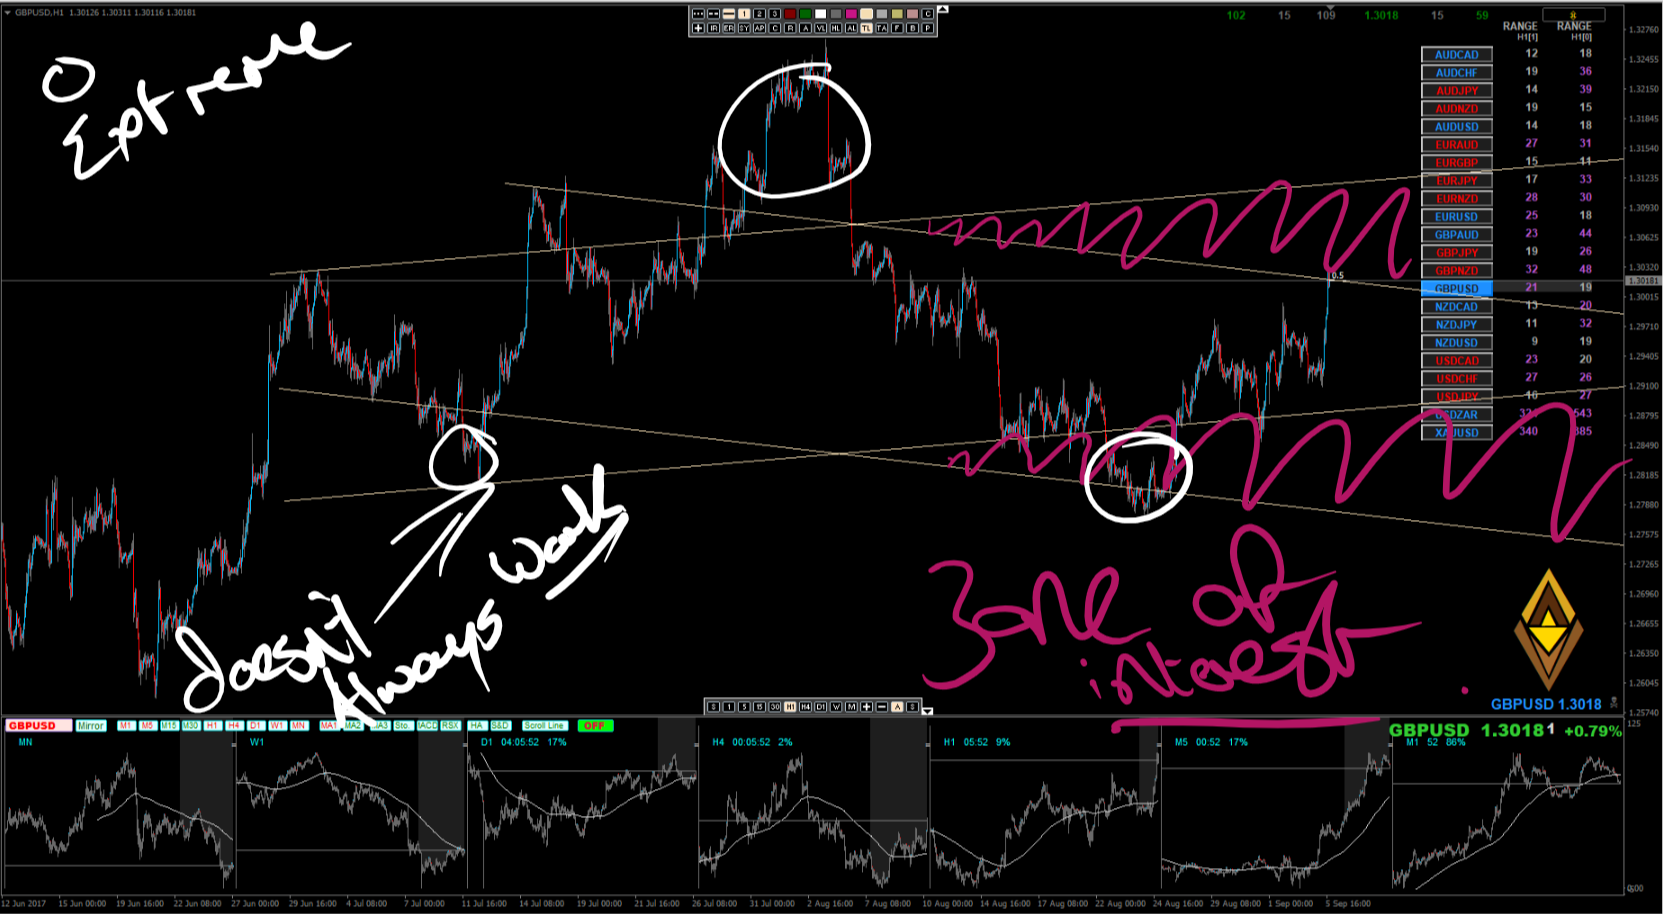
A stop at the extreme is not required, but if it were then you would simply change your position size to give yourself more space.

The flaw in trading away from the extremes is that there is only ONE highest high & lowest low in a given period of time.
If price is at the extreme then it is not below something and if it is not lower than something then how can we go short?

We could wait for a smaller chart to move below something but now we are praying that price moves to the opposite end of the bar and starts expanding in the opposite direction; something that is even less likely than an extreme being THE extreme.

Will there be hundreds of pips between the extremes, yes.
If you know the end then all that you have to do is solve the beginning.


If you want to learn how to read a chart then focus on patterns and breakouts.
[/quote]

quote="Jalarupa"-quote="cwn6161"-quote="Jalarupa"


Pretty bold of you to buy when the previous candle is red! :shock: :wink:[/quote]

Nah, entry was off the extreme OC H1 (dragon)

Then proceeded to Rat entry my way into bigger things...
Also managed to scalp about 50 odd pips in the first two hours of the London Session - closed out 3 other entries at the daily extreme High (saw price running out of steam), so i ended up with a total of 350 odd pips and currently sitting with about 160 pips on the table (Green 2 line is the AVE) waiting for Weekly to go GREEN then I'm gonna buy the pullback (hopefully) :D I love being sick cause I get to trade the whole day... pitty I don't really end up recovering cause I don't rest... Gonna rest now though... :P[/quote][/quote]
__________ THE :smt096 IS A LIE__________

Please add www.kreslik.com to your ad blocker white list.
Thank you for your support.

User avatar
Mira
rank: 1000+ posts
rank: 1000+ posts
Posts: 1729
Joined: Thu Nov 10, 2016 8:37 pm
Reputation: 1608
Gender: None specified
Contact:

Re: How to be a MOnster

Postby Mira » Tue Sep 05, 2017 4:06 pm

The way i'm finding my zones improved but i have to go on now.

"You know what you should do, you know :lol:" - MO

000.png
000.png (34.3 KiB) Viewed 3098 times


This made me think.. if i consider MOMENTUM as the result (the Truth) of a pattern, then momentum is NOT an occasion to enter a trade.
I mean: i imagine MO, Doji, Jala, V8, Mr. Hyde (etc) and the banks/institutions CREATING momentum bars and taking profits when they are over.
Considering a momo as the PAST gives me a logic solution at the "a zone is not the trigger" mystery.

Think about it.. there are momentum bars and non-momentum bars.
After we had a non-momentum bar we could have a series of non-momentum bars, BUT, at the end of the day, the result always will be a momentum bar.

Thus, what could be an 'occasion' to enter a trade? The guys on this board told it from the very first day:

1 - MOMENTUM in direction of profit on a smaller timeframe, because smaller breakouts create bigger patterns.
2 - (?) A NON-MOMENTUM bar closing "around" the zone, because the result of a pattern is always a breakout.
__________ THE :smt096 IS A LIE__________

User avatar
Jalarupa
rank: 1000+ posts
rank: 1000+ posts
Posts: 1300
Joined: Tue Feb 23, 2010 5:50 pm
Reputation: 324
Location: South Africa
Gender: None specified

Re: How to be a MOnster

Postby Jalarupa » Tue Sep 05, 2017 5:07 pm

WOW that post is OLD....

Haha! Damn!

Well here's a chart for you... Consider the following pattern...

Image

Notice the extreme... Let me make it easier for you...

Image

Its a Fat Cat... and the (HEAD) is the extreme...

Image

Large Scale... But Price/Time is Fractal... so repeats itself everywhere...

Image

Small Scale...

Image

So in summation... look for a extreme already being put in by trading the fat cat or slanted fat cat... Or using this as confirmation of your thoughts...

Remember what MO said about Cones... They show Price exhaustion... (Most valuable lesson ever)

Image

Image

I hope this helps... Like MO days these ideas evolve into something simpler, scalable and repeatable...
:smt065

User avatar
MightyOne
rank: 5000+ posts
rank: 5000+ posts
Posts: 6055
Joined: Wed Dec 10, 2008 6:33 pm
Reputation: 560
Gender: Male

Re: How to be a MOnster

Postby MightyOne » Wed Sep 06, 2017 1:56 pm

You give it more thought than I do...
wherever you would place your stop on a daily chart is the same extreme that you should trade away from on a smaller chart.

The money is in managing your risk-box, not in holding for pips.

If you lose then you restore your lines to 8 total and trade at $18 or you stick it out with 6 lines.
If you stuck it out with 6 and lose 3 then you might raise it to 4.5 and $16.50 per line.

Unless your position size is so small that it cannot be reduced, you will never blow up your risk-box unless risking it all is something
that you have decided to do.


AUDNZDH4.png
AUDNZDH4.png (67.62 KiB) Viewed 3030 times

User avatar
Mira
rank: 1000+ posts
rank: 1000+ posts
Posts: 1729
Joined: Thu Nov 10, 2016 8:37 pm
Reputation: 1608
Gender: None specified
Contact:

Re: How to be a MOnster

Postby Mira » Wed Sep 06, 2017 5:16 pm

Thank you Jala and thank you MO.

MightyOne wrote:The money is in managing your risk-box, not in holding for pips.


I believe you MO, but I think that my targets are TOO close :lol:
I traded long from the top of the zone (+ spread and some pip since I looked for momentum on a 5 min chart) to the magenta line.

IMG_1376.PNG
IMG_1376.PNG (64.69 KiB) Viewed 3021 times


I'm not looking for pips.. but do you usually try to hold if price gives signs (?) of continuation?

Thanks
__________ THE :smt096 IS A LIE__________

User avatar
MightyOne
rank: 5000+ posts
rank: 5000+ posts
Posts: 6055
Joined: Wed Dec 10, 2008 6:33 pm
Reputation: 560
Gender: Male

Re: How to be a MOnster

Postby MightyOne » Thu Sep 07, 2017 1:49 am

Mira wrote:I believe you MO, but I think that my targets are TOO close :lol:
I traded long from the top of the zone (+ spread and some pip since I looked for momentum on a 5 min chart) to the magenta line.

I'm not looking for pips.. but do you usually try to hold if price gives signs (?) of continuation?

Thanks


Let's look at a larger picture:

What would happen if your first objective of the day was to absorb 2 lines?:

Day 00: $25/line ($200 in the box)
Day 01: $31 ($250)
Day 02: $39 ($312)
Day 03: $48 ($390)
Day 04: $61 ($488)
Day 05: $76 ($610)
Day 06: $95 ($762)
Day 07: $119 ($953)
Day 08: $149 ($1192)
Day 09: $186 ($1490)
Day 10: $232 ($1862)
Day 11: $291 ($2328)
Day 12: $363 ($2910)
Day 13: $454 ($3637)
Day 14: $568 ($4547)
Day 15: $710 ($5684)
Day 16: $888 ($7105)
Day 17: $1110 ($8881)
Day 18: $1387 ($11102)
Day 19: $1734 ($13877)
Day 20: $2168 ($17347)
And that is just stacking the first trade of the day!
Who knows how many lines you made on trades 2+

The question that should come to mind is "what about margin?"

$2168/line is only $19.63/pip on the monthly chart compared to $314/pip on the hourly chart.
Each time you move to a larger chart you halve your position size and double the width of the lines to make the same amount of money
over larger bar ranges.

Now as the money trickles in on the monthly chart you are going to find that you have enough money to drop down to the weekly chart and then the daily chart and so on and the speed at which you make 'x' doubles all the way down to the hourly.

The decision to hold is always based on the belief that H4+ will make a significant move.
How do you know that? You don't, but you highly suspect it from time to time :D

for_Mira.png
for_Mira.png (13.71 KiB) Viewed 2969 times

Please add www.kreslik.com to your ad blocker white list.
Thank you for your support.


Return to “TheRumpledOne”