How to be a MOnster

free & uncensored discussion arena for TheRumpledOne

Moderator: moderators

User avatar
MightyOne
rank: 5000+ posts
rank: 5000+ posts
Posts: 6055
Joined: Wed Dec 10, 2008 6:33 pm
Reputation: 561
Gender: Male

Re: How to be a MOnster

Postby MightyOne » Sat Jun 10, 2017 9:34 pm

Mira wrote:
MightyOne wrote:
Mira wrote:
Looking better.. MO, do you think that this could be a clear view? Or that I could do better?
Thank you!


What does this picture mean to you?


Mmm.. price wicking (closing below)?


Let's say that the thought bubble is a monthly chart and the zigzag within the box is an hourly, a small section of a single monthly bar.

What do you see yourself doing daily and how do you gravitate towards the big picture of moving size through space?

Please add www.kreslik.com to your ad blocker white list.
Thank you for your support.

tom7ak
rank: 50+ posts
rank: 50+ posts
Posts: 106
Joined: Fri Dec 05, 2014 11:10 pm
Reputation: 159
Gender: None specified

Re: How to be a MOnster

Postby tom7ak » Sat Jun 10, 2017 9:46 pm

No, i dont feel confident. For now its only loose ideas bouncing here and there. GBPJP was a great lesson. It showed I had no proper plan or rules. We tried long we tried short. Thats all fine, we could have profited on both providing we had a sound plan. Which TF did we trade? Where did the price reverse down from? What did we aim for? Perhaps its not that much of a direction change for me, rather trying to build some plan and rules and focus on one thing and not 32:)

I was studying MO`s chart with wick zones. A few things later came and sort of clicked in:
-2D+/D+ extremes
-price rarely goes up and down in a straight line. its fear of missing out on a trade which cause us stay in a trade rather than as MO says get in and out. And even if we do miss out then what? 20 pips a day should be plenty with good MM
-BIAS - if price is above previous day`s extreme why shorting?
- zline concept and removing profits
- wick as a sign of rejection, rejection from where?

ill post some charts in the week


Mira wrote:
tom7ak wrote:Mira i think i am changing directions yet again. No more trading in the zone. No more waiting for the zone to be hit only to be wicked out of a trade. I need sth SIMPLE. Price is going up i buy, price is going down i sell. All the rest (art) is to "impress women" :)20 pips - done for a day. Body shows the way, wick shows the way not. Night


Ok Tom! If you feel confident with what you're doing then it's ok, but when you find your way KEEP IT!

I'm a newbie so I can't teach you anything (first I need to learn too :lol:) but I'm sure of one thing: draw a line in a random place of the chart and go back in time, that line worked as a S/R and price bounced several times on it.
[https://youtu.be/py0IMjd8nII]

you might be a newbie, i dont know. I think i have learnt a lot from you and i appreciate it.

I don't know why it works but it works! Then there are places where price tends to reverse, i.e. overbought/oversold conditions.. or patterns and BOs, and if you trade that horizontal line in that situations you are making real money. (MO please tell me if I'm wrong)

I think that there is no secret.. I don't want to believe that some secret exists!

...If there was, then all that studying would be for nothing and the passion would be gone

How many "Doji zones" have you watched? 1000+?
(Notice that here I'm talking about US, my situation is = yours)
Your eye falls on tops and bottoms, where everything is magic! Then you trade live and doubts arises because we don't know if it's a top or a bottom.. logically.

WHO KNOWS?

We take a loss? We can reverse! Just try the next time!
Our GBPJPY trade was right, direction was right..
it's always the same thing: you take it and everybody will say "Tell me what you see"!
You loose it and they say "Nice try! Price was going up, didn't see??".
No one can predict price = the only thing we need to learn is discipline, no other.

I think that this is the Truth.
you got 2 slow it down
and then u pick it up - PF
-----------------------------------

User avatar
Mira
rank: 1000+ posts
rank: 1000+ posts
Posts: 1729
Joined: Thu Nov 10, 2016 8:37 pm
Reputation: 1608
Gender: None specified
Contact:

Re: How to be a MOnster

Postby Mira » Sun Jun 11, 2017 2:17 pm

MightyOne wrote:
Mira wrote:
MightyOne wrote:
What does this picture mean to you?


Mmm.. price wicking (closing below)?


Let's say that the thought bubble is a monthly chart and the zigzag within the box is an hourly, a small section of a single monthly bar.

What do you see yourself doing daily and how do you gravitate towards the big picture of moving size through space?


I'd try to short from the pattern above, maybe accumulating from the low and double on the pullback (at words :lol: )

Image
__________ THE :smt096 IS A LIE__________

User avatar
Mira
rank: 1000+ posts
rank: 1000+ posts
Posts: 1729
Joined: Thu Nov 10, 2016 8:37 pm
Reputation: 1608
Gender: None specified
Contact:

Re: How to be a MOnster

Postby Mira » Mon Jun 12, 2017 4:18 pm

MightyOne wrote:
What does this picture mean to you?


MO i'm sorry, i want to answer again :lol:

TWO closes form a price level so that was a short! The same in the picture of the thought bubble. Thanks!

THX MO.png
THX MO.png (142.24 KiB) Viewed 3762 times


Now i'm trying to grasp your words about accumulation before the expansion.
The point is that taking profits in the middle looks like the best solution but

1)
Isn't there the risk of losing all the SIZE, trading against your original Idea? Or the 'original idea' exists after a H/L BO?
It seems that the real move sometimes starts from the middle and sometimes from the broken low/high :|

ACCUMULATION.png
ACCUMULATION.png (19.49 KiB) Viewed 3762 times


2)
I'm considering waiting to see an approach to the pattern (and not placing limits as i'm doing) to avoid even more losses, but entering after a wick in direction of loss often is like entering at a worst price to my (blind) eyes. I know that there isn't a way to "confirm" a trade.. but.. :roll:

for MO.png
for MO.png (6.68 KiB) Viewed 3762 times


Thank you much for helping MO! :D
__________ THE :smt096 IS A LIE__________

User avatar
MightyOne
rank: 5000+ posts
rank: 5000+ posts
Posts: 6055
Joined: Wed Dec 10, 2008 6:33 pm
Reputation: 561
Gender: Male

Re: How to be a MOnster

Postby MightyOne » Mon Jun 12, 2017 8:27 pm

You are trading horizontal lines no matter what period you are looking at, but if instead of H1 you are looking at a monthly chart then that is 30 days of price action in that one little bar.

Consider that 2nd red arrow, think about 60 days of trading as price breaks out and returns to the pattern; how much larger is your position size?
If you usually stop at $120/line ($20/pip) on the hourly then that is $1920/line on the monthly chart; of course you would need to have accumulated 16 H1 lines just to have 1 line on the monthly chart.
If you have 5 lines of $120 then you can trade the monthly with (5/2)120 or 2 lines of $300 (about $3.12/pip) or you can use 2 lines of $120 on that chart, 2 lines on another chart, and maybe 1 line somewhere else or simply held as backup (1 line of $120 is 12 lines of $10).

Price does the same things on every chart and period but small charts are closing faster than large charts so you have to learn how to think fast as well as slow.

for_Mira.png
for_Mira.png (13.37 KiB) Viewed 3741 times
2for_mira.png
2for_mira.png (12.67 KiB) Viewed 3741 times

Please add www.kreslik.com to your ad blocker white list.
Thank you for your support.

User avatar
Mira
rank: 1000+ posts
rank: 1000+ posts
Posts: 1729
Joined: Thu Nov 10, 2016 8:37 pm
Reputation: 1608
Gender: None specified
Contact:

Re: How to be a MOnster

Postby Mira » Tue Jun 13, 2017 8:11 am

Long in the zone (Red-Green Lines), target = Orange line.
Fast and easy!

IMG_0486.PNG
IMG_0486.PNG (76.2 KiB) Viewed 3687 times


IMG_0487.PNG
IMG_0487.PNG (57.06 KiB) Viewed 3687 times
__________ THE :smt096 IS A LIE__________

User avatar
Mira
rank: 1000+ posts
rank: 1000+ posts
Posts: 1729
Joined: Thu Nov 10, 2016 8:37 pm
Reputation: 1608
Gender: None specified
Contact:

Re: How to be a MOnster

Postby Mira » Tue Jun 13, 2017 10:45 am

Ping pong!

IMG_0488.PNG
IMG_0488.PNG (72.85 KiB) Viewed 3674 times


Mira wrote:Long in the zone (Red-Green Lines), target = Orange line.
Fast and easy!

IMG_0486.PNG

IMG_0487.PNG
__________ THE :smt096 IS A LIE__________

User avatar
Mira
rank: 1000+ posts
rank: 1000+ posts
Posts: 1729
Joined: Thu Nov 10, 2016 8:37 pm
Reputation: 1608
Gender: None specified
Contact:

Re: How to be a MOnster

Postby Mira » Tue Jun 13, 2017 2:43 pm

Little Devil forming?

EG.png
EG.png (10.19 KiB) Viewed 3657 times
__________ THE :smt096 IS A LIE__________

User avatar
Mira
rank: 1000+ posts
rank: 1000+ posts
Posts: 1729
Joined: Thu Nov 10, 2016 8:37 pm
Reputation: 1608
Gender: None specified
Contact:

Re: How to be a MOnster

Postby Mira » Wed Jun 14, 2017 1:32 pm

Mira wrote:Little Devil forming?

EG.png


EG is doing predictable moves today.. the scenario is still the same.

EG.png
EG.png (14.92 KiB) Viewed 3607 times


The more i go on with chart reading, the more i recognize that MO is right when he says that a proper money management is the REAL key.

Not that Patterns&BOs/Momentum Zones don't work, they work incredibly good :D , but the real challenge is to protect my position (SL) and to reach a decent lot size before a nice move.
__________ THE :smt096 IS A LIE__________

User avatar
MightyOne
rank: 5000+ posts
rank: 5000+ posts
Posts: 6055
Joined: Wed Dec 10, 2008 6:33 pm
Reputation: 561
Gender: Male

Postby MightyOne » Wed Jun 14, 2017 6:08 pm

The spread on this pair is 11/32 on the monthly chart or 34.4%
There is a period in which you can profit from even the most "untradeable" pairs.

Had you originally gone short from the midpoint with two spaces then you would have gained a 3rd space.
If you take that 3rd space off of the table then you can triple up at the midpoint.
The chart then allowed you to exit and double up twice more at the midpoint.
You exited a 3rd time, price reversed, and you doubled at the 'take profit' line; your stop then drops to the
midpoint and your are short 24x your original size.

USDTHB MN
x3_x2.png
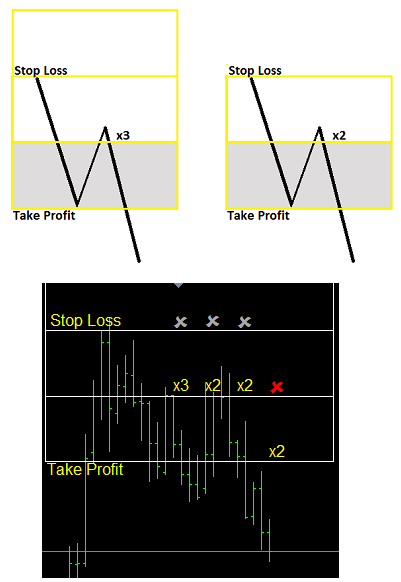
x3_x2.png (22.79 KiB) Viewed 3591 times


You might think to yourself that you are not going to trade the chart because you cannot accumulate on small charts,
where the spread is 11/2 or 550% of one line, but the beauty of EIGHTS strategy is that you can accumulate in one pair
and stack the size on another.

What if you took even a small portion of your daily profits (lines) and stacked it on this CADSGD monthly in the direction of profit?
Now you are trading AND investing!

CADSGDMonthly.png
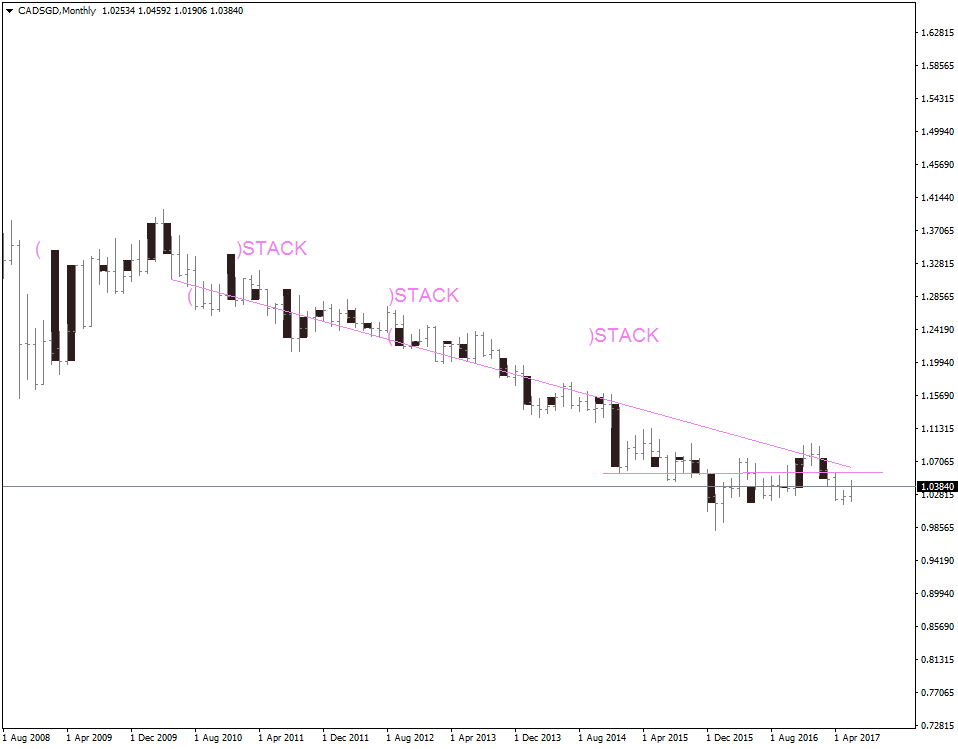
CADSGDMonthly.png (22.03 KiB) Viewed 3591 times


Trading is as easy or as hard as you make it.

AUDSGDH1.png
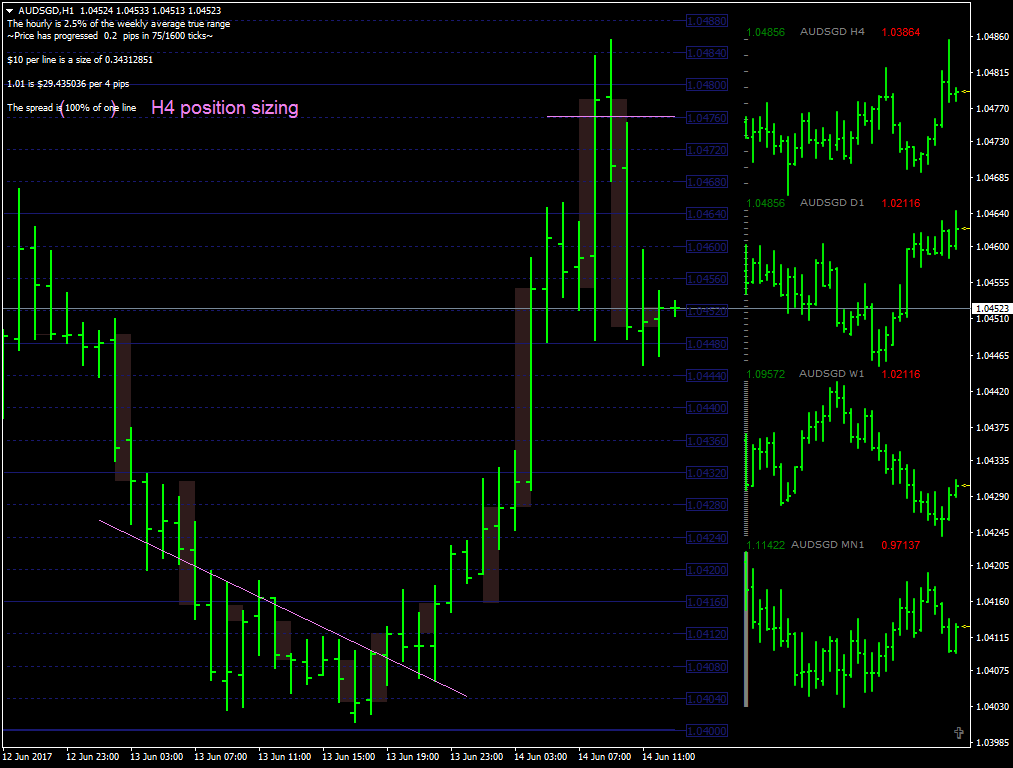
AUDSGDH1.png (56.15 KiB) Viewed 3591 times

Please add www.kreslik.com to your ad blocker white list.
Thank you for your support.


Return to “TheRumpledOne”