How to be a MOnster

free & uncensored discussion arena for TheRumpledOne

Moderator: moderators

User avatar
Mira
rank: 1000+ posts
rank: 1000+ posts
Posts: 1729
Joined: Thu Nov 10, 2016 8:37 pm
Reputation: 1608
Gender: None specified
Contact:

Re: How to be a MOnster

Postby Mira » Thu Jun 08, 2017 8:37 pm

MightyOne wrote:
Mira wrote:Finally :lol:

EG target.png

Mira wrote:A very fast one

EG.png


for_Mira.png


Thank you MO

I see the middle as a pattern, then there is a breakout (momentum), price returning to the pattern and making a breakout to the other side (momentum eating momentum).. but i don't know if it's the right way.
I bought at the first oval and sold at the second one :lol:
Attachments
for_MO.png
for_MO.png (13.61 KiB) Viewed 3137 times
__________ THE :smt096 IS A LIE__________

Please add www.kreslik.com to your ad blocker white list.
Thank you for your support.

User avatar
Mira
rank: 1000+ posts
rank: 1000+ posts
Posts: 1729
Joined: Thu Nov 10, 2016 8:37 pm
Reputation: 1608
Gender: None specified
Contact:

Re: How to be a MOnster

Postby Mira » Thu Jun 08, 2017 9:06 pm

TOM :shock:

O.O.png
O.O.png (13.86 KiB) Viewed 3131 times


tom7ak wrote:And not mine either. Perhaps pair selection was not the best. Contradicting TFs. Going long looks to me against H4 and D1, going short, against H1. I think i call it a day for now. Unless there is a breakout/down from wedge pattern on H1. Time to go through it all and try to learn from mistakes. Thanks Mira
__________ THE :smt096 IS A LIE__________

tom7ak
rank: 50+ posts
rank: 50+ posts
Posts: 106
Joined: Fri Dec 05, 2014 11:10 pm
Reputation: 159
Gender: None specified

Re: How to be a MOnster

Postby tom7ak » Thu Jun 08, 2017 9:11 pm

Ia ma just looking at it and cannot figure it out. One platform shows the move on H1, but not on H4 or D1. The other shows the moves on HTF but a gap on LTF. Nice move, are u in it?
you got 2 slow it down
and then u pick it up - PF
-----------------------------------

User avatar
Mira
rank: 1000+ posts
rank: 1000+ posts
Posts: 1729
Joined: Thu Nov 10, 2016 8:37 pm
Reputation: 1608
Gender: None specified
Contact:

Re: How to be a MOnster

Postby Mira » Thu Jun 08, 2017 11:22 pm

tom7ak wrote:Ia ma just looking at it and cannot figure it out. One platform shows the move on H1, but not on H4 or D1. The other shows the moves on HTF but a gap on LTF. Nice move, are u in it?


Nope :(
I needed a few beers after we spent all day trying to short and then BOOM! Epic drop.. but this is trading lol

btw today I noticed how weekly, daily and H4 were showing a perfect bearish setup (D1 attached) but I was blinded by H1. My mistake, sorry.

IMG_0455.PNG
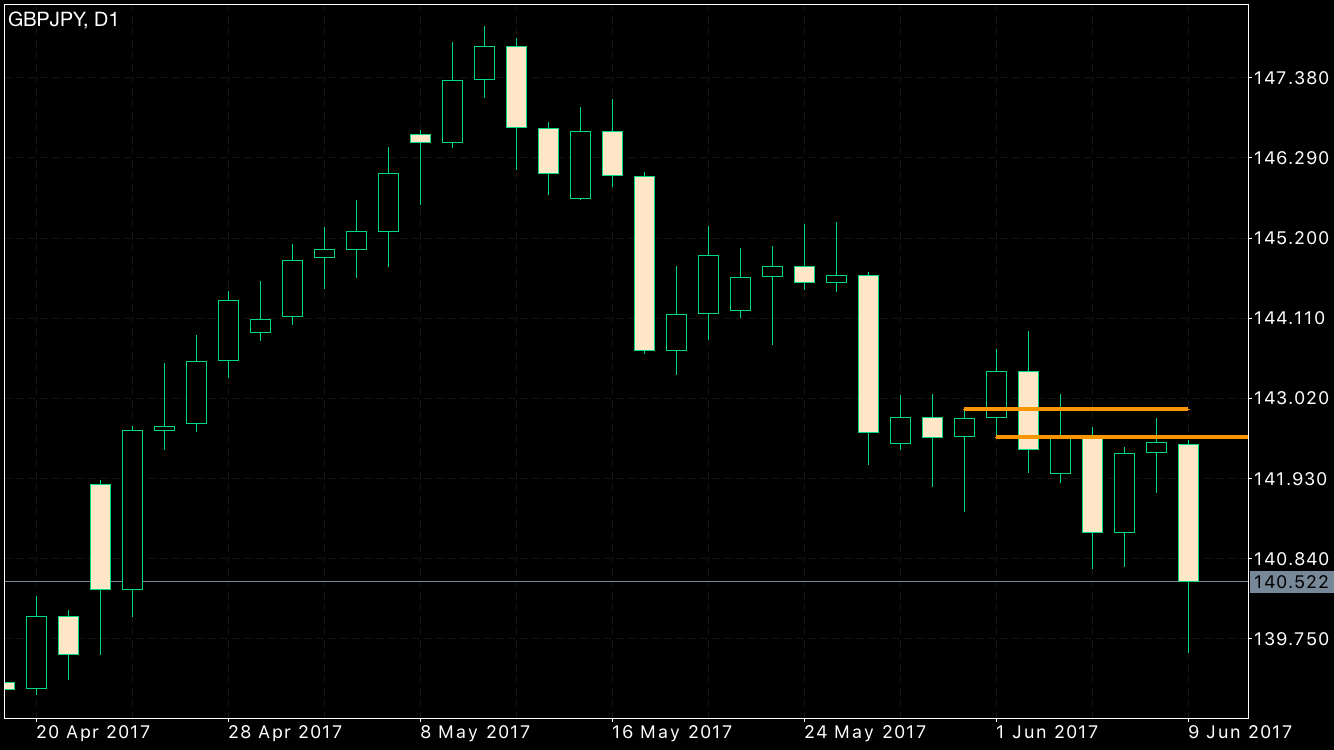
IMG_0455.PNG (61.15 KiB) Viewed 3237 times


The sad thing is that, if you too remember, Doji told that price need to broke the zone WITH momentum before we can consider the trade as a loss.. and looking at H1 there was NO bullish momentum breaking the zone, only closes below :evil: :lol:


Ps. I checked correlate markets too.. there were many beautiful illusions on LTFS! GBPJPY was one of the best (clear) pair, stars were aligned on all the chart perdiods.
__________ THE :smt096 IS A LIE__________

tom7ak
rank: 50+ posts
rank: 50+ posts
Posts: 106
Joined: Fri Dec 05, 2014 11:10 pm
Reputation: 159
Gender: None specified

Re: How to be a MOnster

Postby tom7ak » Fri Jun 09, 2017 10:50 am

As you said HTFs were pointing down. Bias and setup was there plus warning signs on H1, rejection on bearish zone, break of bullish momentum. Take a look at MOs markings on my previous chart. We still could have made a nice profit by going long too though.
you got 2 slow it down
and then u pick it up - PF
-----------------------------------

Please add www.kreslik.com to your ad blocker white list.
Thank you for your support.

tom7ak
rank: 50+ posts
rank: 50+ posts
Posts: 106
Joined: Fri Dec 05, 2014 11:10 pm
Reputation: 159
Gender: None specified

Re: How to be a MOnster

Postby tom7ak » Fri Jun 09, 2017 10:55 am

LTF.png
LTF.png (10.74 KiB) Viewed 3202 times
you got 2 slow it down
and then u pick it up - PF
-----------------------------------

User avatar
Mira
rank: 1000+ posts
rank: 1000+ posts
Posts: 1729
Joined: Thu Nov 10, 2016 8:37 pm
Reputation: 1608
Gender: None specified
Contact:

Re: Re:

Postby Mira » Fri Jun 09, 2017 11:48 am

(The Ideas: therumpledone/the-ideas-that-i-trade-by-t3256/page3780)

MightyOne wrote:I put an 'x' on the pattern closes and used TRO style arrows to indicate bars that broke out of a pattern.

Keep in mind that how I interpret H4+ bars is not necessarily how I interpret smaller charts.

Day 1: price opened higher than the blue bias line so we trade long (this is also the monthly open).
Price closes weak indicating that the current state of the expansion is in the downward direction.

Day 2: price crosses the first relevant close and then reverses past its own open indicating that nothing has changed,
price is going down.

Day 3: there is a pattern breakout.
The previous price action is that of overlapping bars and a cone and there is no reason to expect that price will thrust its way
through the zero-line at this time.

Many times there will be that second thrust, a breakout of a breakout, but in all probability the next candle that closes in the same direction is going to be smaller or there are going to be overlapping bars; I think that it is better to just take your money off of the table and wait to see what price does.

Day 4: price returns to the pattern, if you were long from a smaller chart then you would exit after this large bar closed.
The idea hasn't changed, the pattern is and has been lower closes, we are looking for shorts.

Day 5: as expected, a secondary thrust upwards after a large bar.
If price could consolidate above the blue line, on a smaller chart, then I would consider the possibility of a rise to the extreme of day 1...
but this didn't happen (see H4 chart below).

USDJPYDaily.pngUSDJPYH4.png


Ok I found it! :D Yep.. the first pullback is the best!
Thanks MO!


Mira wrote:
MightyOne wrote:Trend_Setter.png


Thank you for the charts MO!
I gave them a try today but I still can't see how to spot patterns and breakouts (i mean without EIGHTS).
Btw I'm sure they are useful tools that could help me thinking out of the box, so I'm not going to leave them!

[off topic]

Today I tried a few entries on GBPJPY and I noticed how I was trading away from a pattern/zone creating breakouts bullish/bearish, something like a midpoint..

But do you think that a pattern loses some "power" after several pullbacks?
Or that there is some difference between a total fail and a breakout to the other side of the pattern (change in direction) after a previous successful pullback?

Thank you MO!
__________ THE :smt096 IS A LIE__________

User avatar
Mira
rank: 1000+ posts
rank: 1000+ posts
Posts: 1729
Joined: Thu Nov 10, 2016 8:37 pm
Reputation: 1608
Gender: None specified
Contact:

Re: How to be a MOnster

Postby Mira » Fri Jun 09, 2017 1:27 pm

Ok.. now, what to do :lol:

GJ.png
GJ.png (20.25 KiB) Viewed 3187 times
__________ THE :smt096 IS A LIE__________

User avatar
MightyOne
rank: 5000+ posts
rank: 5000+ posts
Posts: 6055
Joined: Wed Dec 10, 2008 6:33 pm
Reputation: 561
Gender: Male

Re: How to be a MOnster: Post by MightyOne » Mon May 29, 2017 4:01 pm

Postby MightyOne » Fri Jun 09, 2017 1:54 pm

Code: Select all

 
I just look at it like this:
1) because of the prev. overlapping bars (sideways vs trendy PA) and the range of the bar, this is a take profit area.
2) a second close in an area forms a tradable price level
3) this bar is a breakout, it is important to note which direction price is moving away from a price level.
4) price returned to the micro take profit level of '3', on the prev. bar, bounced off of the price level and then made a higher close.
5) wicks in the direction of loss, the closes start to form a higher price level.
6) price is breaking up and away from the price level. While the close of this bar was weak, bar '3' was your first breakout, bar '4' was your strongest close higher, and this bar closed in the same area.
7) price fell away from 'something', take note.
8) price fell away from 'something' & this is a clear break of an uptrend line
9) In which direction do you think price is moving away from a price level?
?) someone thinks that price is going up...

You know, just go through the bars and write a story.

If price is not trending and you see a bar like '7' then you will be more inclined to buy at lower prices (where did it fall to?) instead of high breakouts.
If you start to notice strength then you switch over to paying higher prices.


for_Mira.png
for_Mira.png (114.26 KiB) Viewed 3185 times
2for_mira.png
2for_mira.png (135.38 KiB) Viewed 3185 times

User avatar
Mira
rank: 1000+ posts
rank: 1000+ posts
Posts: 1729
Joined: Thu Nov 10, 2016 8:37 pm
Reputation: 1608
Gender: None specified
Contact:

Re: How to be a MOnster

Postby Mira » Fri Jun 09, 2017 2:02 pm

I also want to post this quote from Doji[*].
Now i'm not trying to blind myself, nor i want to say that all the trades have to work at 100%.. but Doji said several times that failures, trading with momentum, are very rare.. AND I BELIEVE HIM! So i had some thoughts about it..

dojirock wrote:
Mira wrote:So, if we define Momentum a close over the previous extreme, then do we want to see price closing over the origin of the extreme's BO (to see a Mo breaking Mo)?
[OR i'm just going crazy lol]

For Doji 1.png

for Doji 2.png

Thank you Doji :)


Now were getting somewhere! Great effort Mira! A few of your lines are off.
Bearish Mo takes a close below previous candles Low(extreme). Its this low that we draw the zline from which will pierce the body of the Momentum candle. The 2 candles together give us a green light on Bearish Momentum. Just the opposite from Bullish Momentum, and for that Momentum to be valid it also consist of 2 candles. So all in all a bearish Mo and bullish Mo consist of 4 candles. There can be non Mo candles between them. We are only looking at 1 time frame at this point.(overlays).

Were taking steps. Hopefully you guys can see them unfold as we go. Im trying to move quickly, but not to quick as to lose you.
- just a chart = odds are against us
- defined MO = slight improvement in odds
- defined two types of MO = even better odds yet
- using the two types of MO as one Momentum setup= Now the odds are surely in our favor!!

Ponder this........
Once we draw the 2 types of Momentum in this defined way(key being having to be defined, which was missing from the trading plan)
What if that became a zone?

Another key point, to back up that this works on any chart or time frame due to its the essence of PA......
Take a look at the custom candle indi. It doesnt matter what candles get grouped, the above will be visible!

doji


"So all in all a bearish Mo and bullish Mo consist of 4 candles."

:o Uh! I'm saying this because i took several trades in zones formed by 3 candles (since i forgot this post from Doji - LOL) and they gave me many problems (50/60% of success :roll: ).
Again, i don't want to blind myself, but all the zones formed by 4 candles worked like voodoo.. the others (3 bars) not so good.
Maybe i underestimated the rules ... :?:


[*](beginners-forum/a-fresh-start-doji-s-trading-journal-t3029/page3720)
__________ THE :smt096 IS A LIE__________

Please add www.kreslik.com to your ad blocker white list.
Thank you for your support.


Return to “TheRumpledOne”