Hi MightyOne!

Everything it's ok and i'm glad to see you back.
What about you? How are you?
Thanks for your markups, i don't know how you knew it but i wasn't considering price leaving without me

Now I'm grasping your words, accumulating on temporary zones/"scalps"/opposite trades add size to positions BEFORE the big move happens! Thank you
btw i didn't get P&F OSC idea, it would be cool to read more about your studies!
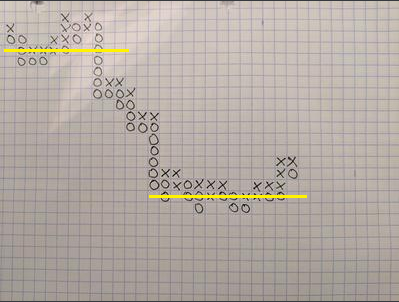
All I see is that
1) if price changes color (from third row) you re-start from the first row, if it changes color in row 2 the column is still valid
2) if price keeps in the previous direction you keep going down in the column
3) 7th row = End.
Hoping I'm not totally wrong

thanks!
It is not that I know your problems as much as it is an intimate understanding of my own shortcomings
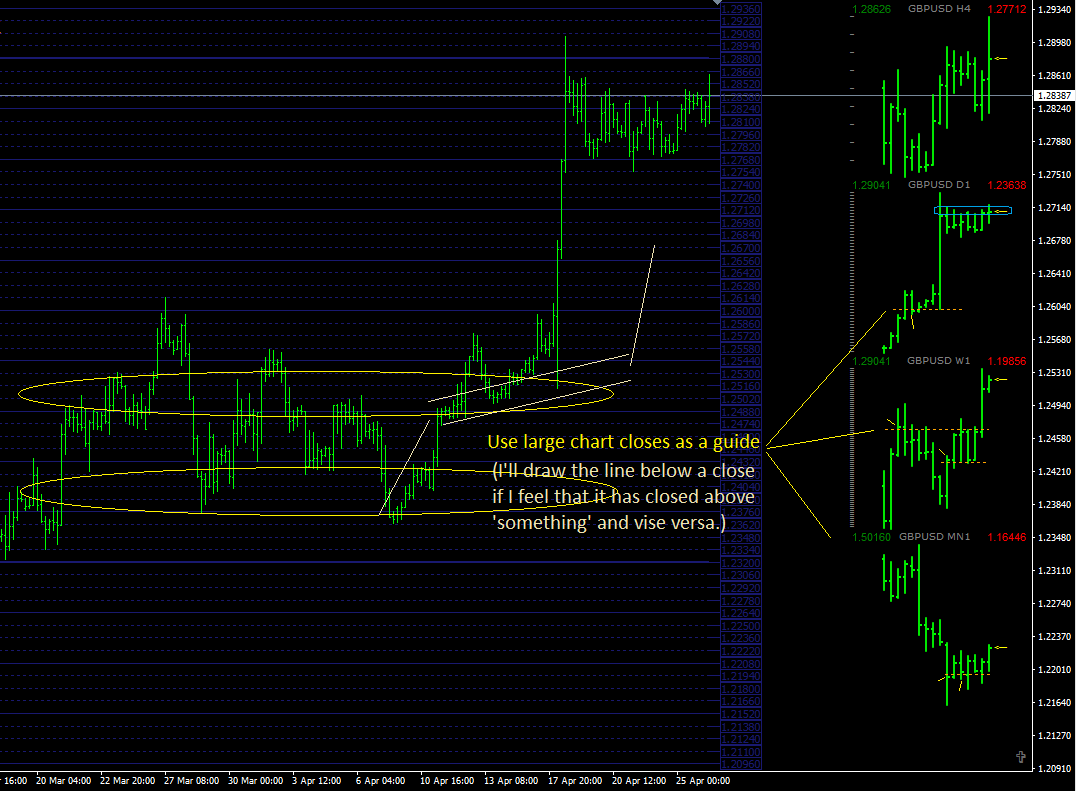
Trading is just horizontal lines, patterns, and breakouts...
I did my fair share of making trading harder than it had to be.
You can take trades when price touches a line or when it is between two lines, that's it.
You risk so many lines and you make so many lines.
- for_Mira.png (52.69 KiB) Viewed 3377 times
Point & Figure is just a chart of price passing through horizontal lines.
Believe it or not, the chart below is the same chart as the 'Big Road' Oscillator
that I attached in the prev. post, it is just plotted differently;
- simple_trends.png (180.7 KiB) Viewed 3377 times
the difference is that the 'Big Road' plots in one direction, down.
According to 1-box reversal rules, there must be at least 2 decisions in each column so
if you plot a single X and it switches to O then it gets placed under the X.
I only care about the answer to one question & that is whether price
IS moving up or down.
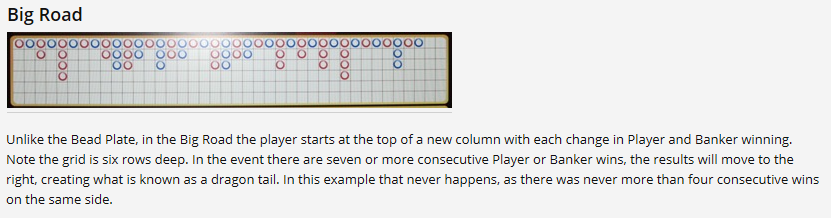
- Big_Road.png (92.06 KiB) Viewed 3377 times


 IS A LIE__________
