TRO DYNAMIC SR 2CAN

post your indicators here

Moderator: moderators

User avatar
TheRumpledOne
rank: 10000+ posts
rank: 10000+ posts
Posts: 15544
Joined: Sun May 14, 2006 9:31 pm
Reputation: 3035
Location: Oregon
Real name: Avery T. Horton, Jr.
Gender: None specified
Contact:

TRO DYNAMIC SR 2CAN

Postby TheRumpledOne » Thu May 17, 2007 4:51 pm

TRO DYNAMIC SR 2CAN

Image


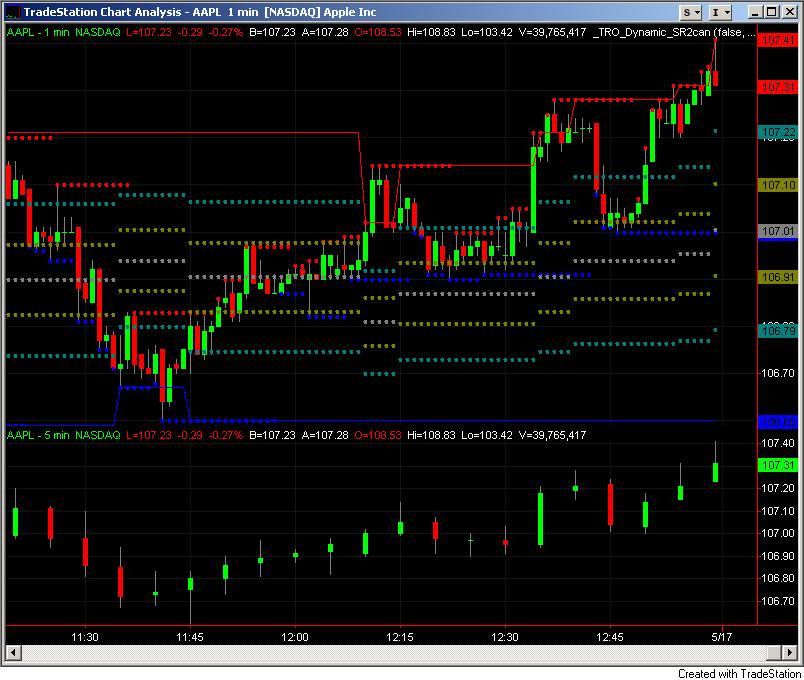
TRO DYNAMIC SR 2CAN plots dynamic support/resistance for 2 different intervals on the same chart.

The fib dots are plotted for data 2.

In the example, data 1 is a 1 min and data 2 is 5 min.

Data 1 support/resistance are the blue/red dots.

Data 2 support/resistance are the blue/red lines.

ELD attached.


NOTE MAY 21, 2007 ATTACHED WORKSPACE.
Attachments
TRO_DYNAMIC_SR_2can.tsw
(32 KiB) Downloaded 399 times
TRO_DYNAMIC_SR2CAN.ELD
(9.84 KiB) Downloaded 464 times
Last edited by TheRumpledOne on Mon May 21, 2007 10:35 pm, edited 1 time in total.
IT'S NOT WHAT YOU TRADE, IT'S HOW YOU TRADE IT!

Please do NOT PM me with trading or coding questions, post them in a thread.

Please add www.kreslik.com to your ad blocker white list.
Thank you for your support.

Susana
rank: <50 posts
rank: <50 posts
Posts: 47
Joined: Mon Feb 19, 2007 3:17 pm
Reputation: 0
Gender: None specified

Postby Susana » Thu May 17, 2007 10:37 pm

Thank you, sounds promising.


Return to “Tradestation indicators”