I like HL's and I using my luxuriant imagination to interpret what price is doing.

Something like Silva Method to visualize where price can be at the end of day.
Whether it’s a desire to defy physical limitations, push the boundaries of imagination, or just beat the odds, stories abound of extraordinary people doing extraordinary things. People do manifest desires out of thin air. Conventional thinking may call it luck, but at Silva we hold a bigger picture. We understand the role that intention plays in shaping what we experience as ‘reality’. This is what is at the core of ‘manifesting’.
I'm using this MO
explanation.
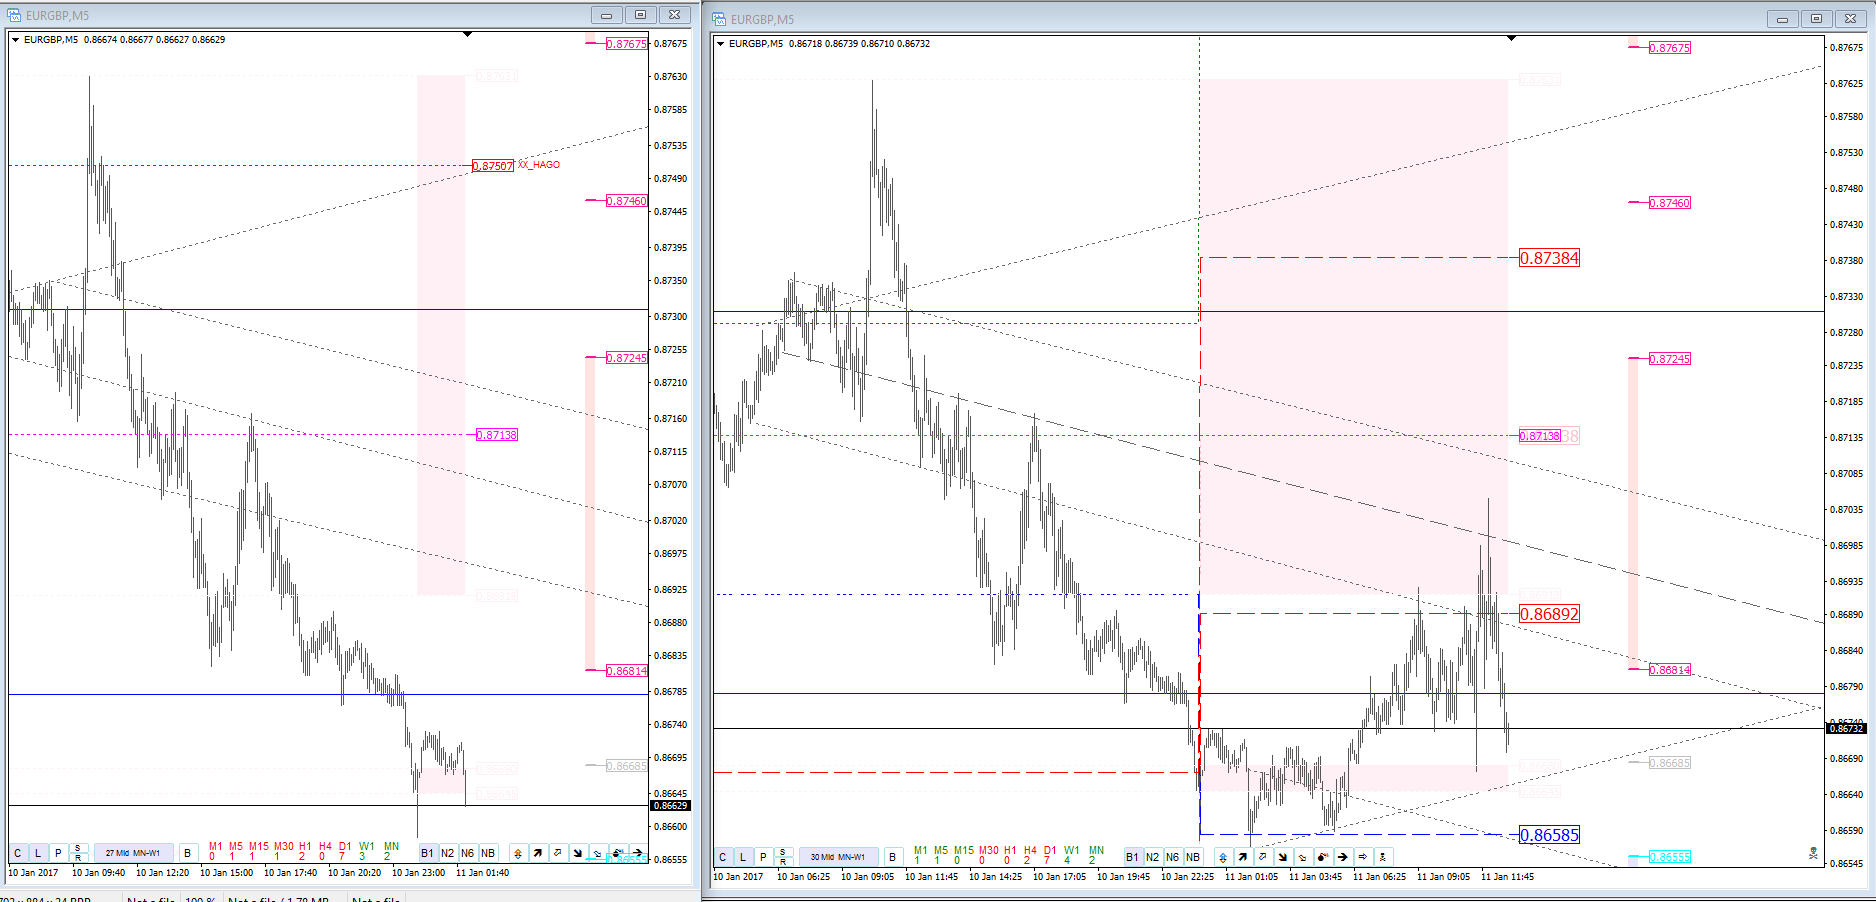
On prev. pic you can see that bias was long. Week open (gold line) above prev. midpoint and above HI Hago, price also left blue box (weekly htbl).
I move this trade to HTF earlier after my target was hit and I exit Crash Zone mid (near XX Hago).
I also went short after V with small size because of late entry. I edited TRO skyline indi to plot HAGO and OPEN (Period_Choice1 for Hago, Period_Choice2 for Open) for back testing. On right pic: red lines HI LO, blue open, green XX OO. You need play to find answer

. I personally don't like lines which move (like current midpoint or RAT zone) that why I started to develop MO idea of HAGO to lower TF. After month of back testing I found that only W1 and D1 Hago are worth to look in some situations. Unfortunately my health slow down my researches.
- eg1265.png (66.76 KiB) Viewed 4384 times
EDIT: Forgot to add that on right Hago-skyline settings were: PC1:1440 PC2:1440.


 I'm in love


 IS A LIE__________
