TheCrumpledOne
) The current candles "close" is the current price.
) Risk is always a dollar amount.
If your lines are 1.2% apart and your entry is 1/3 size then your space triples (3.6%).
Push the button again and your space is 1/2 of 3.6 (1.8%)
Push the button a third time and your space is 2/3 of 1.8% (1.2%)
So, when you scale in, you are basically entering on an H4, dropping to an M5, and then landing on an M1.
Look at it as the importance that price goes up now rather than a little later.
Once you reach 3/3 then you lose very little space moving from 3 to 4 to 5 to 6, 6 to 8 to 10 to 12, etc.
) "two-wide" is a distance of two lines...it makes more sense if you are looking at one of these 2 line reversal charts:
It's a bit messy because I wasn't planning on posting it

|-6 -7 -8|is the area that I marked on the bar chart.
How did I select the area? It is simply the two areas above the low of -9.
-9 to -7 is the reversal from the low and you have as high as -6 to go long.
There was a breakout at -5 and price went as high as -4 so our new entry area is |-5 -6 -7|.
You can use the same method for adding size or you can use the breakout.
) Trust the bias.
If you are experienced and you see something different then do something different.
) "Something" is anything.
The important part is that you use it once you define it.
The only thing that is "wrong" is moving your "something" up and down in a small area while trying to interpret "above" and "below";
If your something is the daily open and you move the line to the low pivot breakout then only move the line down for the rest of the day.
) Did I miss something?
If you needed a hammer then you would reach for it without thinking & if you didn't need it then you wouldn't even think about the tool; the same with technical analysis.
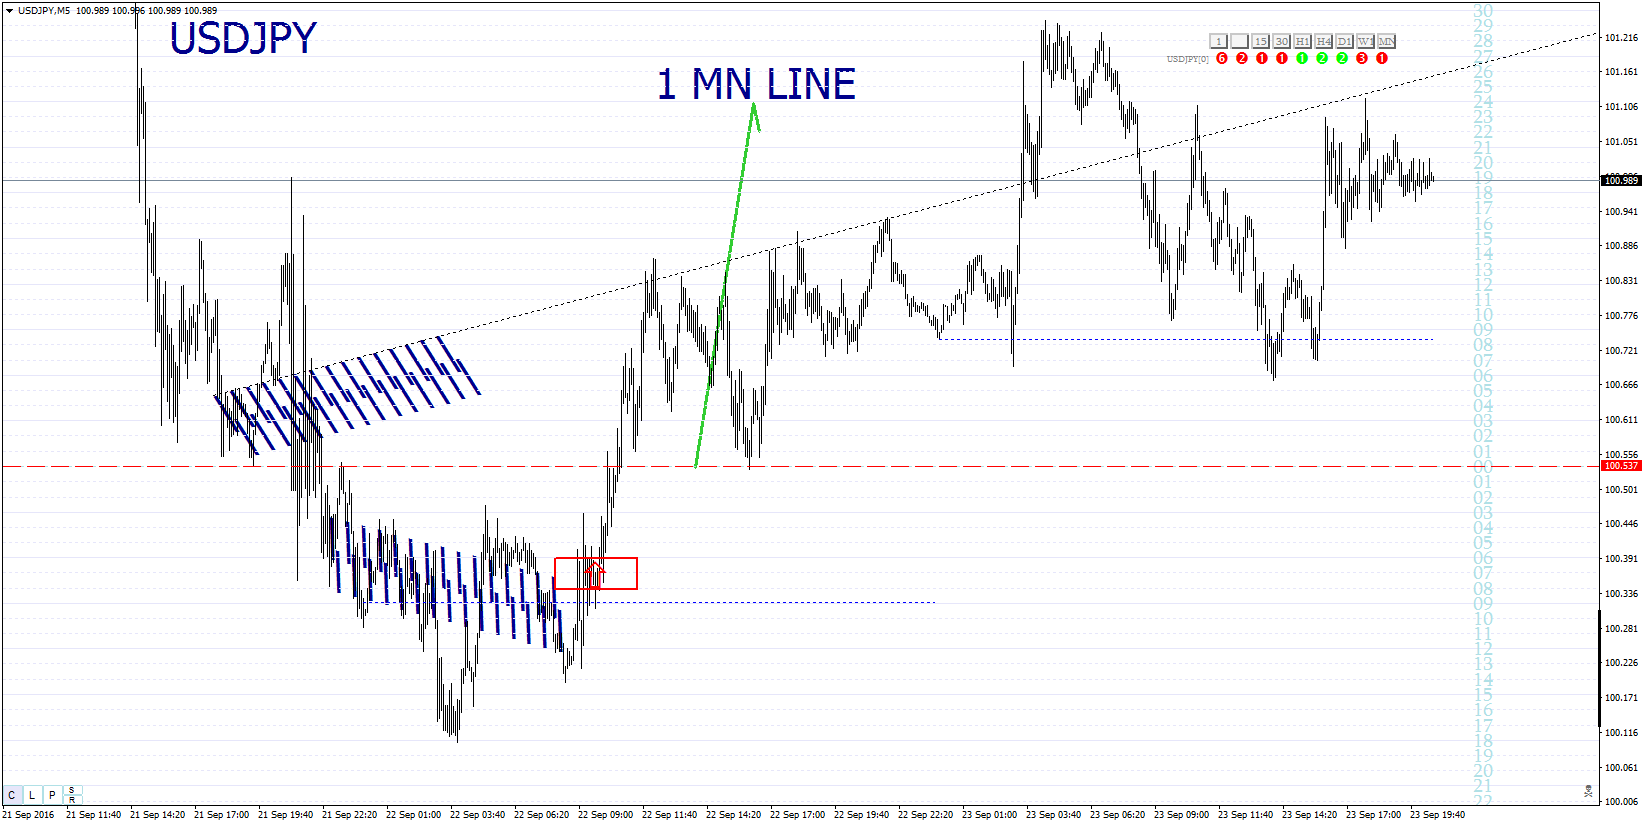
- USDJPYM5.png (77.33 KiB) Viewed 4746 times


