razorboy wrote:Does this chart set up give you a positive mathematical expectancy?
Peter Crowns gave you everything you need to know...stop with the silly bounces, crosses or whatever. Work one signal and back test, back test, back test - this is the only way you will get the confidence you need to keep putting on trades. Use a signal that keeps your losses short and let your profits run........take a trade, put in a stop loss and walk away. The worst you will do is lose, which is exactly what happens when you cut a trade short. You need to build up the discipline to let them run, which if you look at this logically, should not be too hard given your results (and my early results) by cutting them short.
You are not the limiting factor(I assume you are a fully capable being and able to turn on a computer, launch your software and enter trades), the ability not to function like a casino is the limiting factor. Do you understand the probabilities behind a blackjack or roulette wheel?prochargedmopar wrote:Thx, tmanbone,
No cudo's until I'm successful.
SOON.
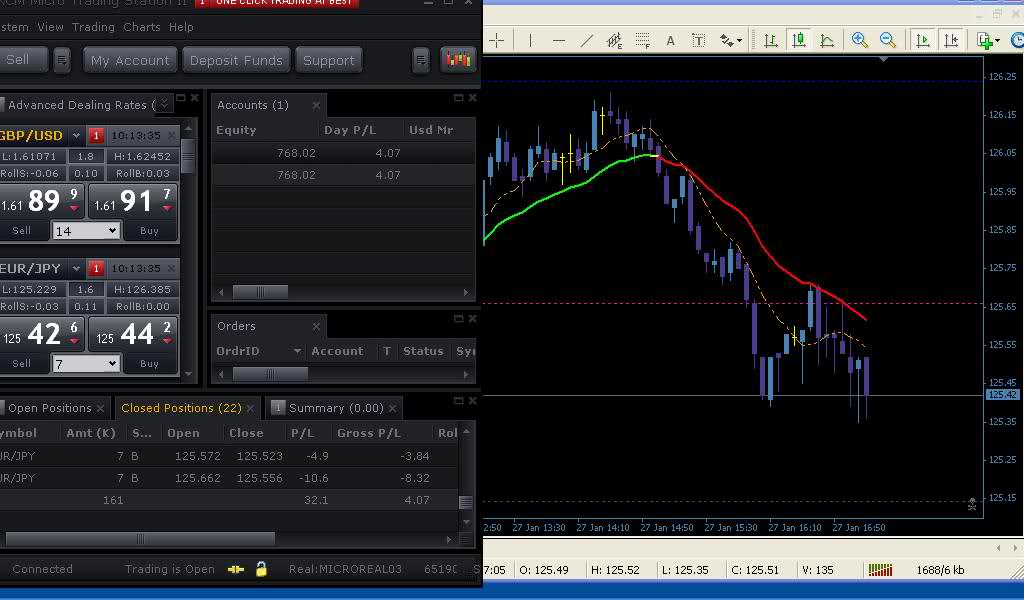
Ruff night at the office.
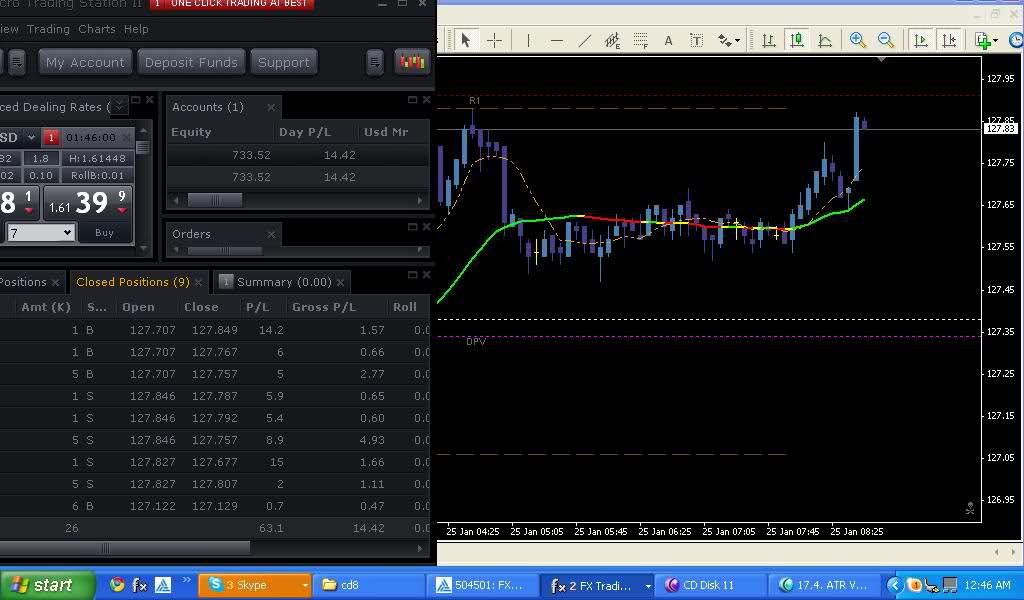
I've decided to use this chart setup until March 31st Minimum.
No changes,
No searching for systems,
No new indicators (sorry TRO, no 2010's for me)
I will trade bounces, breaks, retests, and crosses.
Couple MA's and some horizontal lines.
I am the limiting factor, NOT the chart, NOT the indicators!
A list of prices with net change at hand gives you a positive mathematical expectancy!! This chart setup should be worlds ahead of that. There are so many (quality) trades available it's INSANE.
Holding the trade, Now that is what we are working on by gaining a deeper and deeper understanding of the market itself/ how price moves/ and psychology.
I'll say it again.
I am the limiting factor!!!
By way of my thinking.
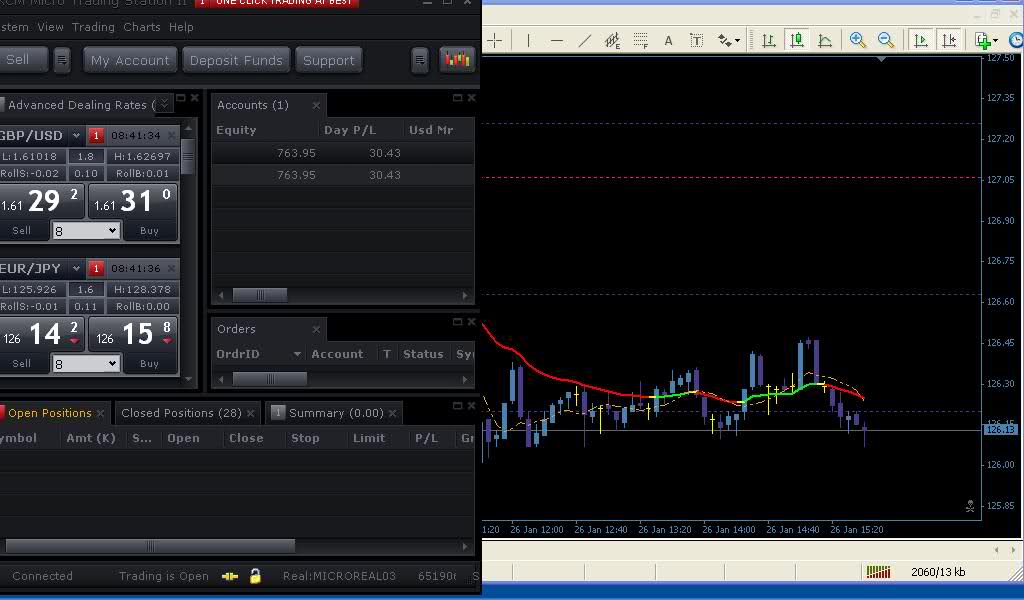
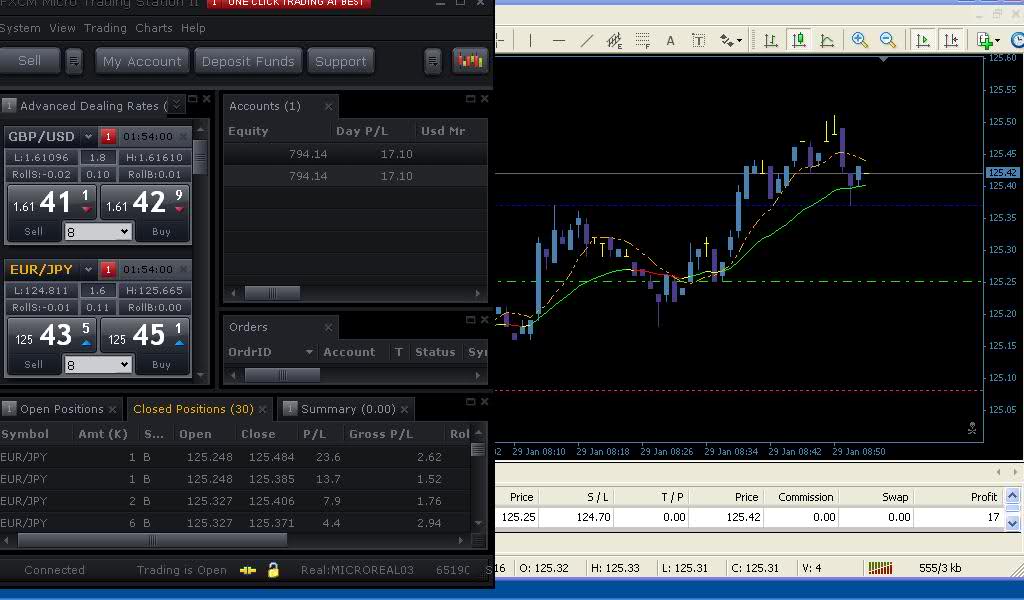
Not sure of the odds on this one but I see the profit 15 min after market had opened and I entered late.
+10ish at first support level, let other half run to demand area.
+31ish 2nd half.
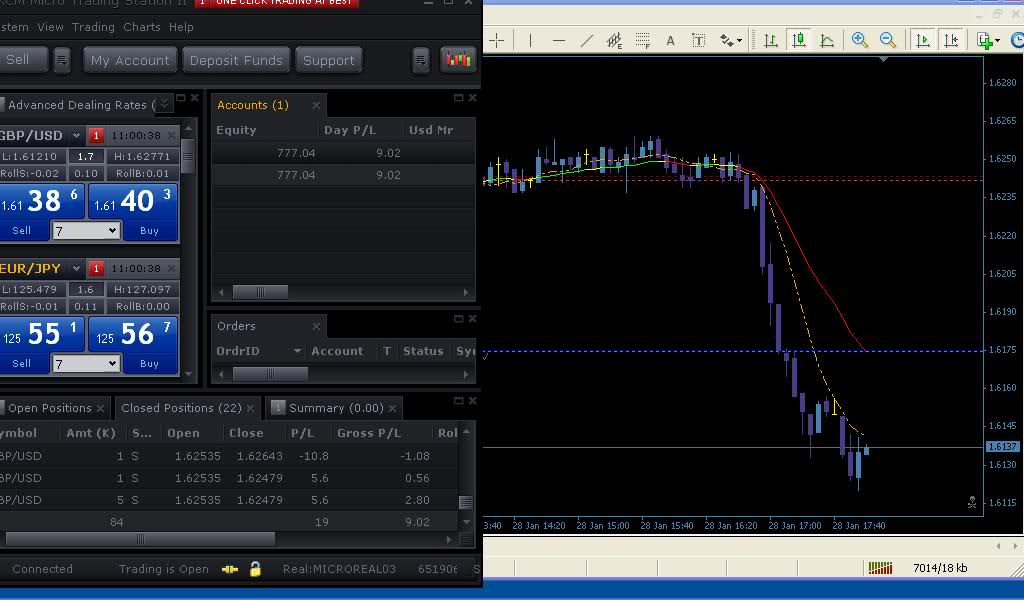
DO YOU SEE THAT PRICE OPENED 70 PIPS UP AND RIGHT AT A SUPPLY ZONE........LOOK LEFT. And then, I'll be jiggered, it bounced 25+ pips off demand. Hmmm Could have hit it both ways.
THIS IS A M1 CHART.