Postby razorboy » Thu Nov 06, 2008 1:12 am
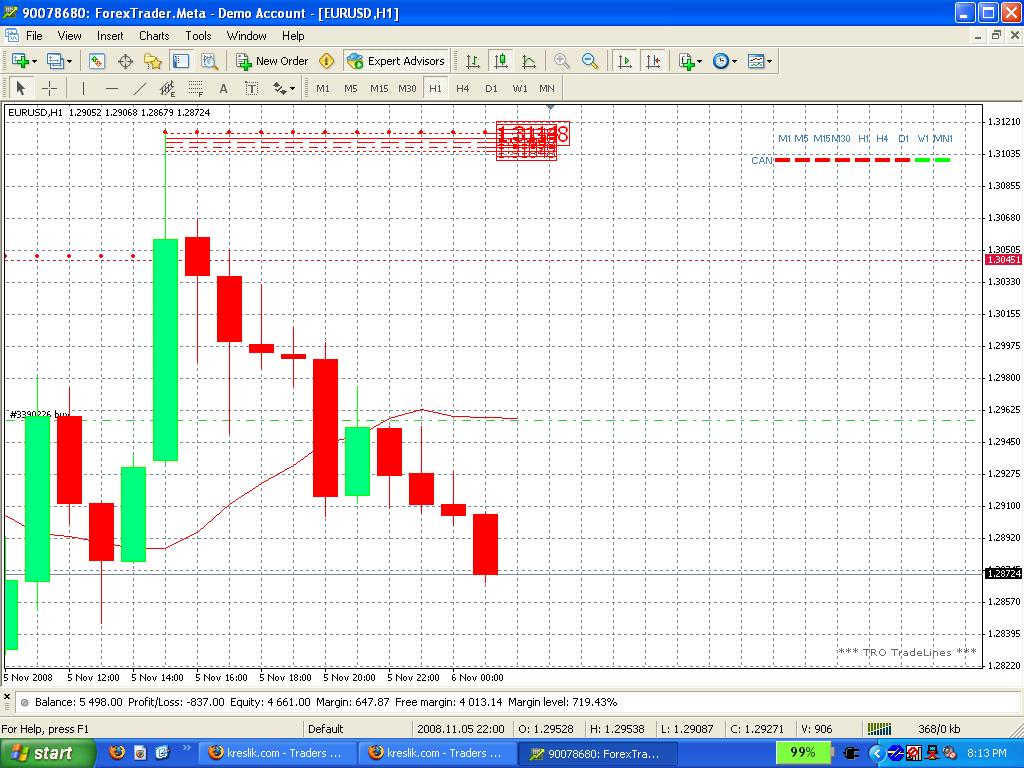
I just installed these (i uploaded the pic)
Set the look back period to 21. Not sure if I did something wrong. Take a look at the pic.
Looking at TRO's charts - not mine here, i see the following
I assume that the idea here is to trade the current bar in the with the color of the numbers (numbers are red, so you only go short) "
DO NOT EVEN THINK ABOUT ENTERING AGAINST THE COLOR OF THE LINES UNLESS ALL LINES HAVE BEEN CROSSED."
Then the trend changed and the numbers went green, H1 went green, a new candle started, and it was time to go long.
then, as time progressed, the current candle dropped and turned red.
Obviously, the trend changed, the question is how would i have know whether and where I should or should not have gone long on this candle in this situation. Just looking at the candles themselves, without the TRO trend line, I would have probably not picked that candle to go long on as it opened above the close of the previous one, to me and indication that the trend was continuing. Although on your charts there are about 20 minutes between the time the candle was green and when it was red, that flip can happen pretty fast
Josh
-
Attachments
-
- tro_trendlines.jpg (176.56 KiB) Viewed 5635 times