PLEASE let me know what you think of this trade and any suggestions!
Thanks
Moderator: moderators
cfabian wrote:es/pip, MO
I clearly see that, so now I'd like further clarification on the following:
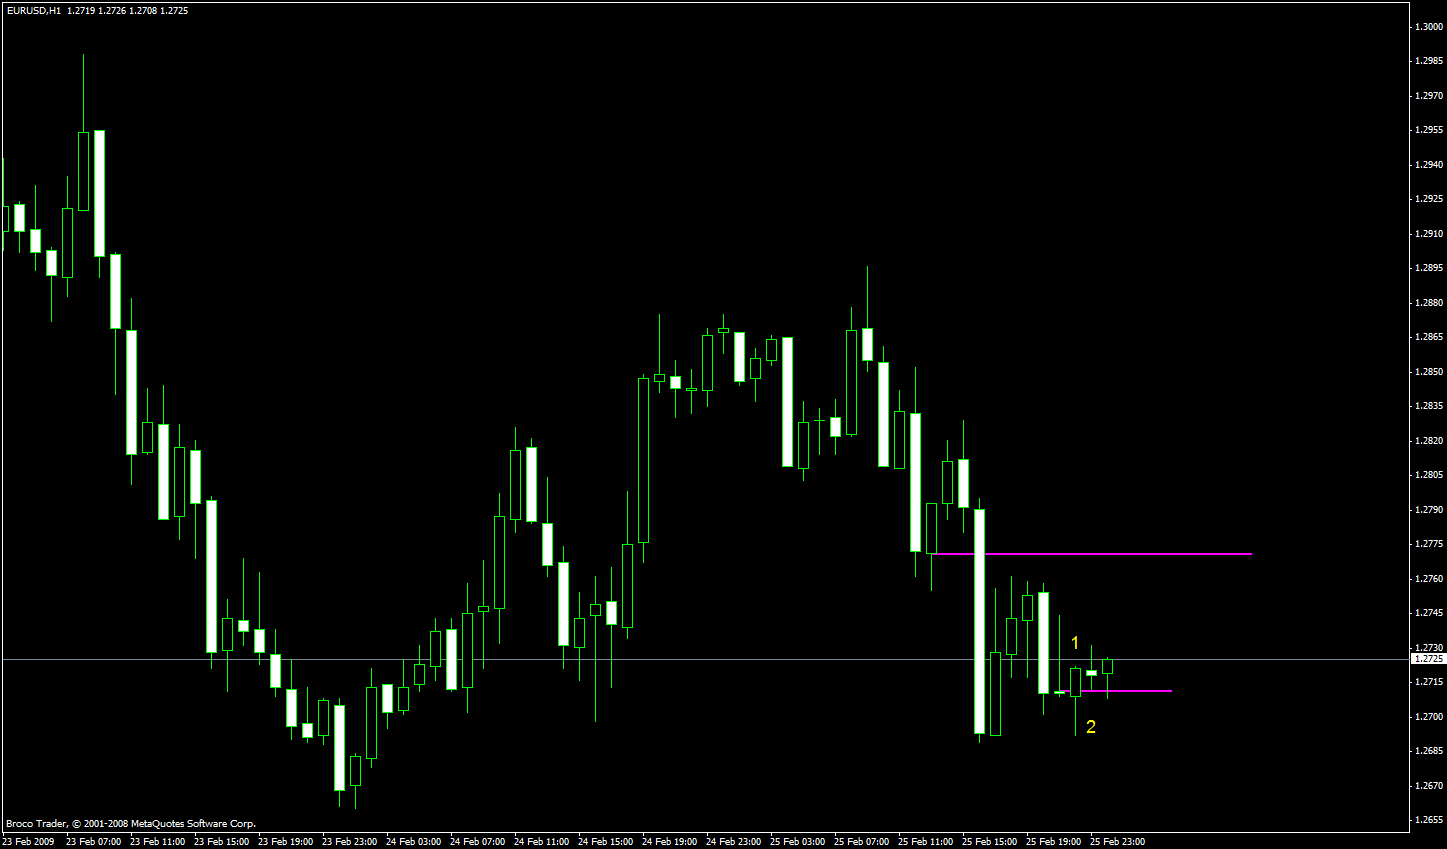
1. 1 -2 pattern (body in direction of profit, wick in dir of loss) needs to be one next to the other, or can be a gap of more candles?
2. When you see this 1-2 pattern, you enter on the wick of 2 (on the z line or better), or wait to the next candle, after candle 2 cloeses to ensure candle 2 really wicks the ZL?
Thanks for putting the spices on this topic.es/pip wrote:cfabian wrote:es/pip
Sorry but I don't see why this was an incorrect setup?
Can you please detail explain your thought on this? and how MO clarified your thoughts as well?
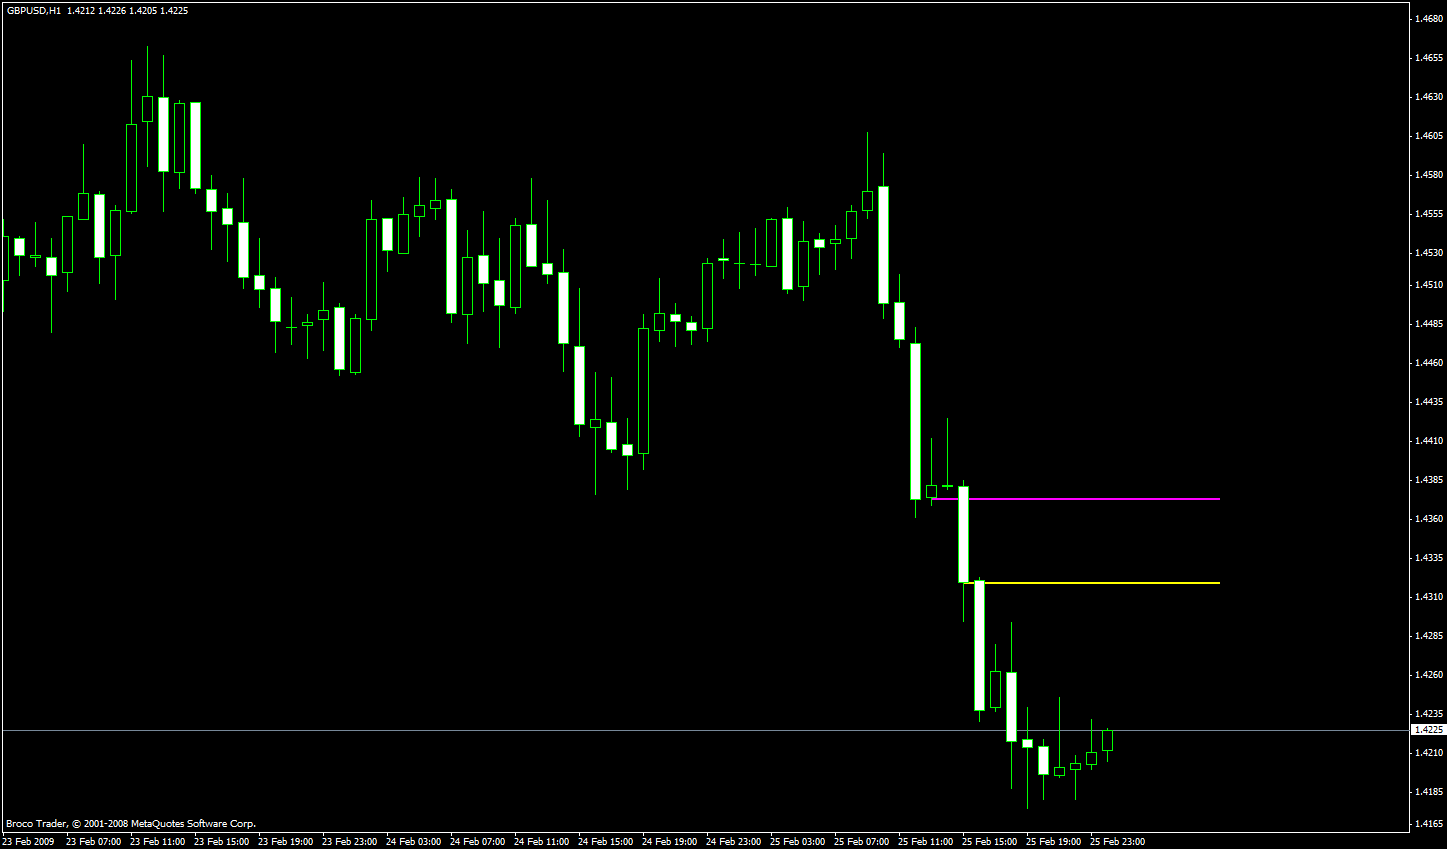
To me bar 1 clearly breaks previous bar, where you set the lower yellow line, and the candle with the "x" comes back down, touch the line to zero previous breakout, a doji and then ramp up. Just don't get what you guys are thinking and/or seeing..... and I belive that's the reason I haven't been as successful as you do. I'm very much hooked into this ZL concept, but need little bit more thoughts.
Thanks a lot for your helpes/pip wrote:MO,
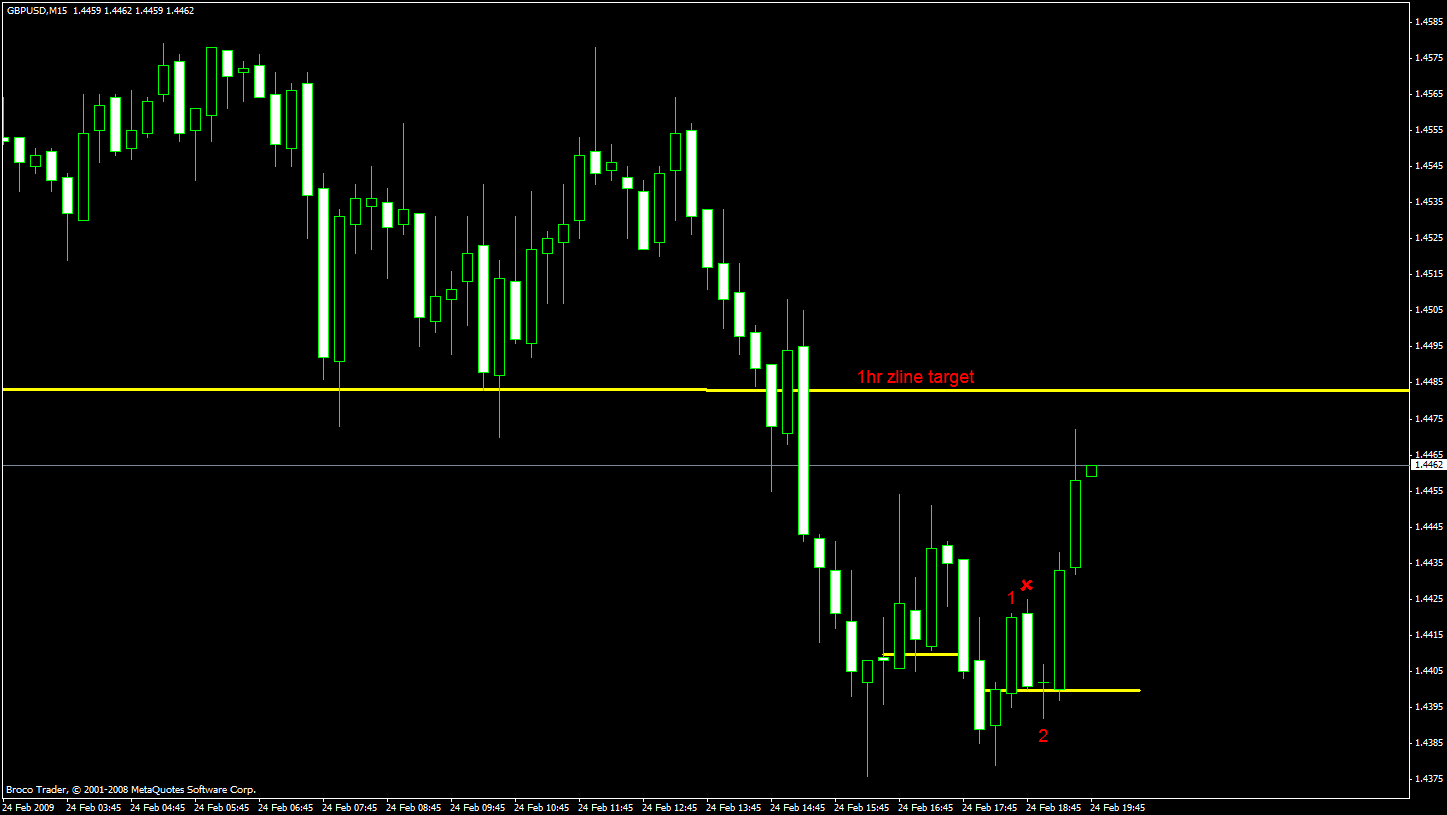
what are your thoughts when you see this happen
i am not in this trade
i went down to the 1 and 5 and couldn't find a 1 2
do you average into it on the way up
or
just pass on it
thanks
in that chart u get a body in direction of profit followed by a body in direction of loss and then a wick in direction of loss---------------for me i am not as gung ho to take that one
so I go down in timframes and try and get a 1-2 on them-----MO just gave another way to trade it
when MO was asked earlier in this thread about how he enters and exits--- he responded it is different all the time bec the market is different at different times-------------------------that would explain this setup


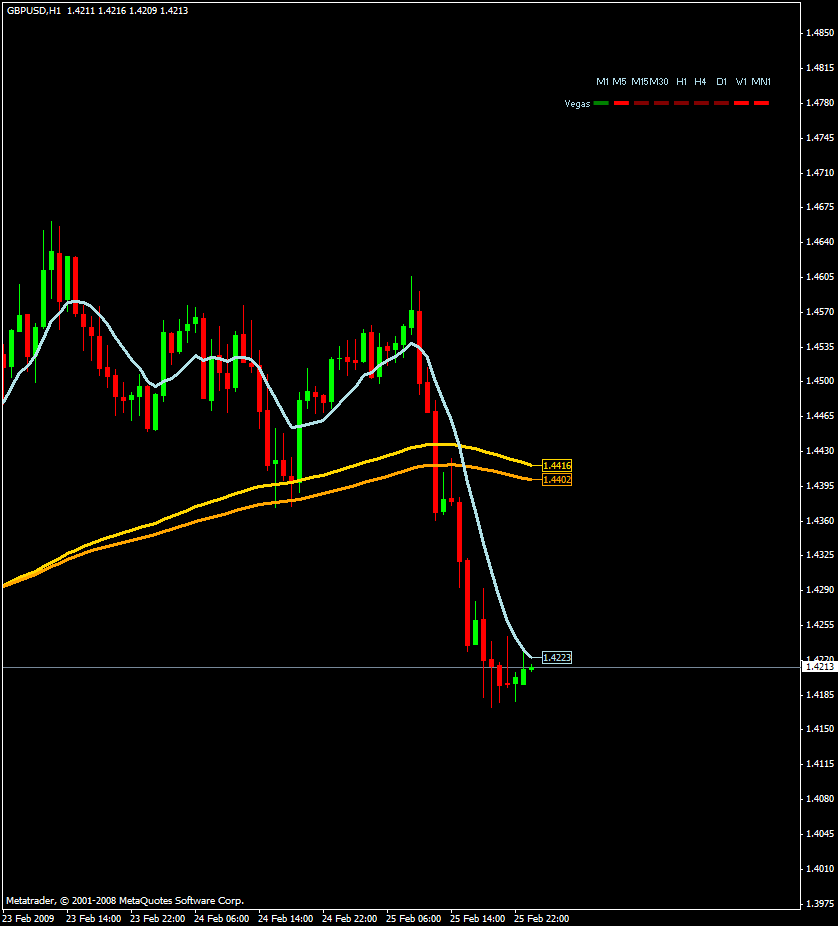
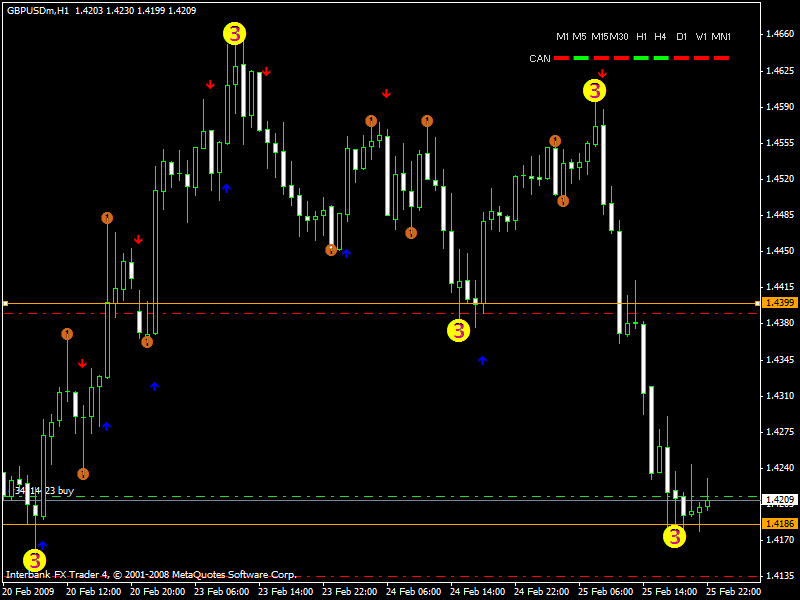
ajaymein wrote:Just placed a ZL trade on the GBP/USD based on the 1hr chart...the GREEN line is where I entered, the two YELLOW Lines are where I placed the ZLs, and and TOP RED line is where my TP is and the bottom RED line is my SL. I have a 75pip Trailing Stop in place in case price does not retrace this high...This is the first chart i posted too so hope it works out good!
PLEASE let me know what you think of this trade and any suggestions!
Thanks
es/pip wrote:ajaymein wrote:Just placed a ZL trade on the GBP/USD based on the 1hr chart...the GREEN line is where I entered, the two YELLOW Lines are where I placed the ZLs, and and TOP RED line is where my TP is and the bottom RED line is my SL. I have a 75pip Trailing Stop in place in case price does not retrace this high...This is the first chart i posted too so hope it works out good!
PLEASE let me know what you think of this trade and any suggestions!
Thanks
can you change your chart to show me where you are basing your zlines from expand the chart and draw the zline from the bar you are basing it off of
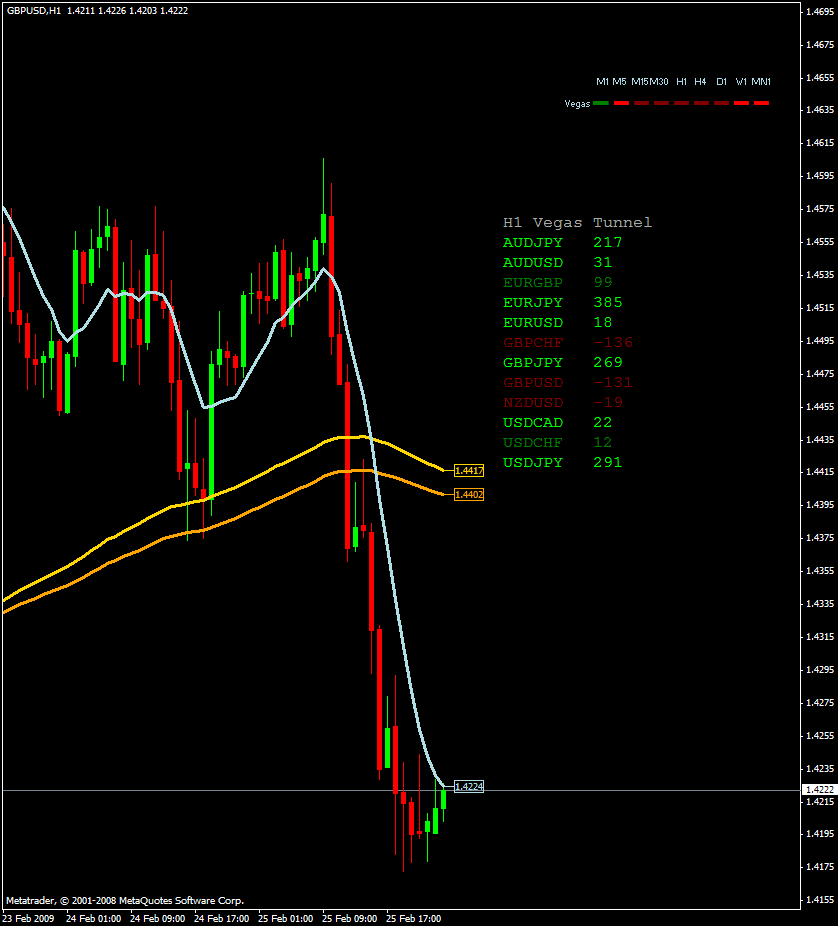
TheRumpledOne wrote:VEGAS TUNNEL
I think the Vegas Tunnel ( H1 version ) is one of the best free systems available. Someone mentioned it the other day. So I decided to write a multimeter for it.
Free MT4 version of TRO_TUNNEL and TRO_MulitMeter_VegasTunnel, including SOURCE CODE, attached.
PLEASE DO NOT POST MY INDICATORS!!