
PTG wrote:Mr. Hyde wrote:PTG wrote:I mean read this post from Dragon33 post75210#p75210
you might have to use this link beginners-forum/a-fresh-start-doji-s-trading-journal-t3029/page2870
it's about images_cache/i43.tinypic.com__x5qiic.png and images_cache/i41.tinypic.com__dokkqs.png
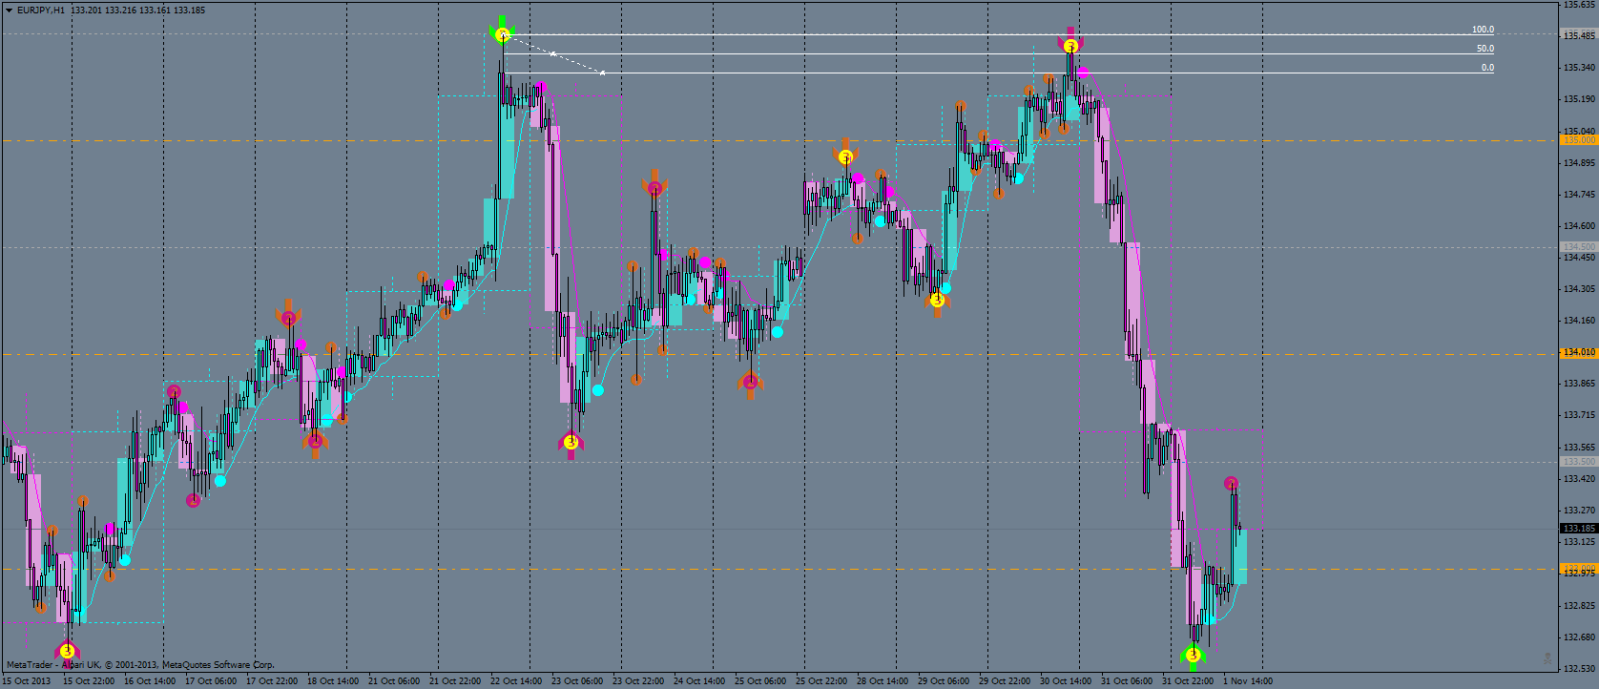
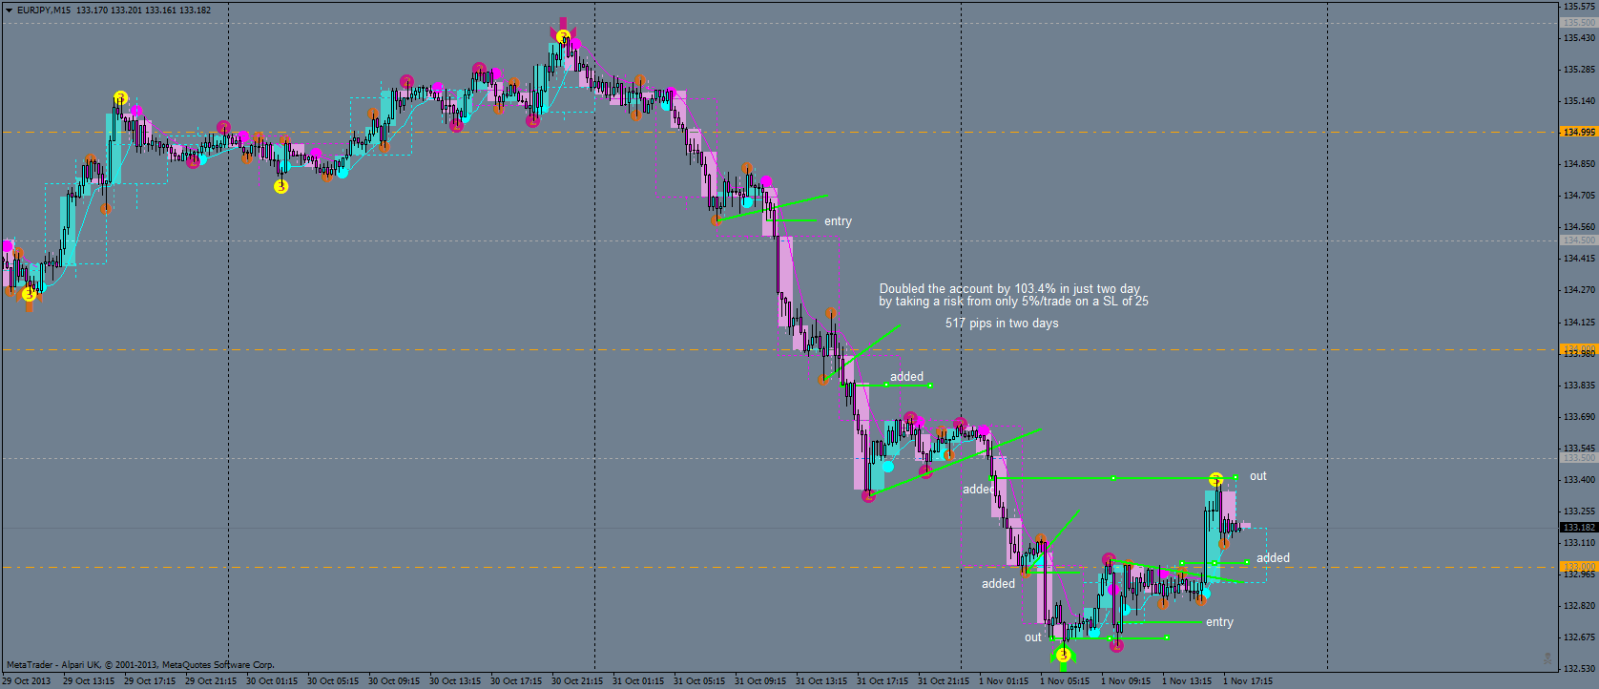
Compare the screenshots with the screenshot below to see the potential.
2018-03-19_1934.png
"Trade caught by watching the fail on the daily, those trades pay back good. So no need to trade every day!!!"
There's your dead giveaway right there
PTG, right after the area you mark what about short here, why wouldn't you start looking for a long half way down. You have 3 nice bullish candles that close above the high pivot. Prices makes it right to the 50% area, prints a sema, stays in place then you have a m15 candles moving and closing above the h1 open, giving you a perfect chance to trade with candle color.
Because there is a bigger picture to take into account and it's getting in an area where you'd be looking for at least a bigger pull back since is had gone up for 2-ish weeks and that it bounced off of a half BRN that has shown to be relevant in the past (= others have been acting upon it). You don't want to go long in an area of overhead resistance after a long run up; you wait or you look for a short regardless of 50% and whatnot.
Also, looking back at it, I notice that RBNZ talking head Spencer blew some hot air; you often see a run up for days-weeks anticipating an event like that and then after the event it fizzles (also happens in stocks, e.g. Apple is said to introduce yet another useless piece of crap and the masses are buying stock like there is no tomorrow, then after the introduction, when the expectation is gone, the stock tanks). In this case it went up a bit more for half a day or so, pulling in more longs ("let's go long") and running them right into overhead resistance.
Thanks for the explanation.
 )
)

 )
)
 IS A LIE__________
