Postby ***FX-JEDI*** » Thu Jun 25, 2009 1:00 pm
Hi Humble.
I have plenty of charts open & didn't have KR indi on ones I took screen shots of. Many thanks to TRO once again.
I like to trade KR's off smaller time frames for entry see post pic for examples, I wait for price to retrace, so yes sometimes this might take a day for price to retrace down to a fib level, pulled from the KR day. some days if market is strong price will not retrace much & if you wait for a retracement you may not get it...
If you know what you are doing, then you could ride the retrace down to the fib levels, but no guarantee price will retrace much..
I screen shot note there is a 30 min KR at day hi, this you could ride down a bit, same for the multiple hammers for bearish Kr you could ride price up to the retracement level. then short it as shown in pic.
Regards ***FX-JEDI***
***Notes for pic.
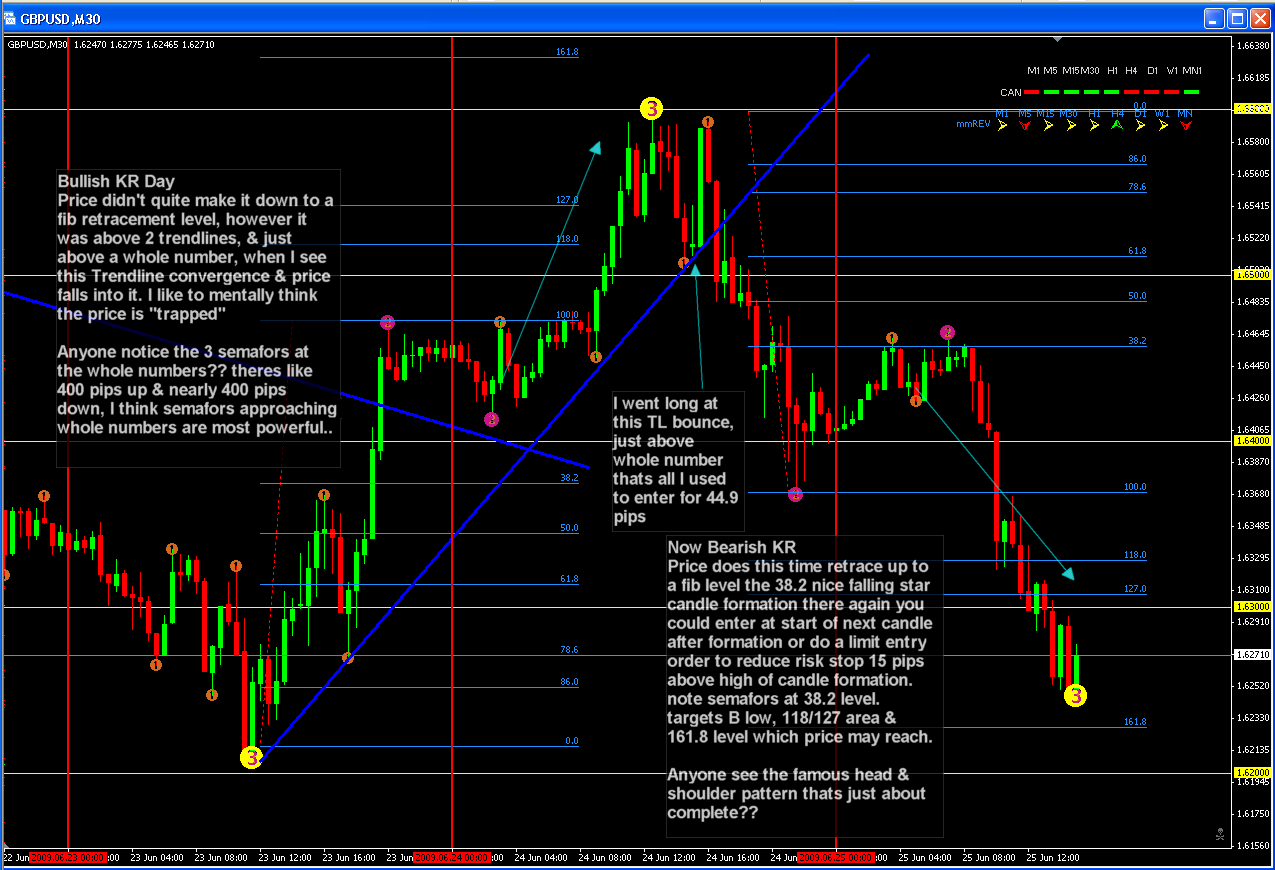
Bullish KR Day
Price didn't quite make it down to a fib retracement level, however it was above 2 trendlines, & just above a whole number, when I see this Trendline convergence & price falls into it. I like to mentally think the price is "trapped" & technically it just has to much support there, & price bounces off this area, (I believe price follows path of least resistance, as like water, electricty, humans, wind etc..), also giving a nice Hammer candle to trade off, which just happens to be a KR on the 30 min candle look how explosive the next 30 min was. so entry at start of next candle after bullish hammer. entry would be 1.6435 or you could do a limit entry order halfway down bullish candle formation targets B hi, 118/127 area & 161.8 level.
stop would be 10 pips below bullish hammer = 33pips or limit order would reduce that.
Anyone notice the 3 semafors at the whole numbers?? theres like 400 pips up & nearly 400 pips down, I think semafors approaching whole numbers are most powerful..
-
Attachments
-
- Screenshot - 25_06_2009 , 10_12_19 PM.png (227.76 KiB) Viewed 5475 times


